Research Reports
The Case for Raising Auto Insurance Minimums
June 25, 2024Executive Summary
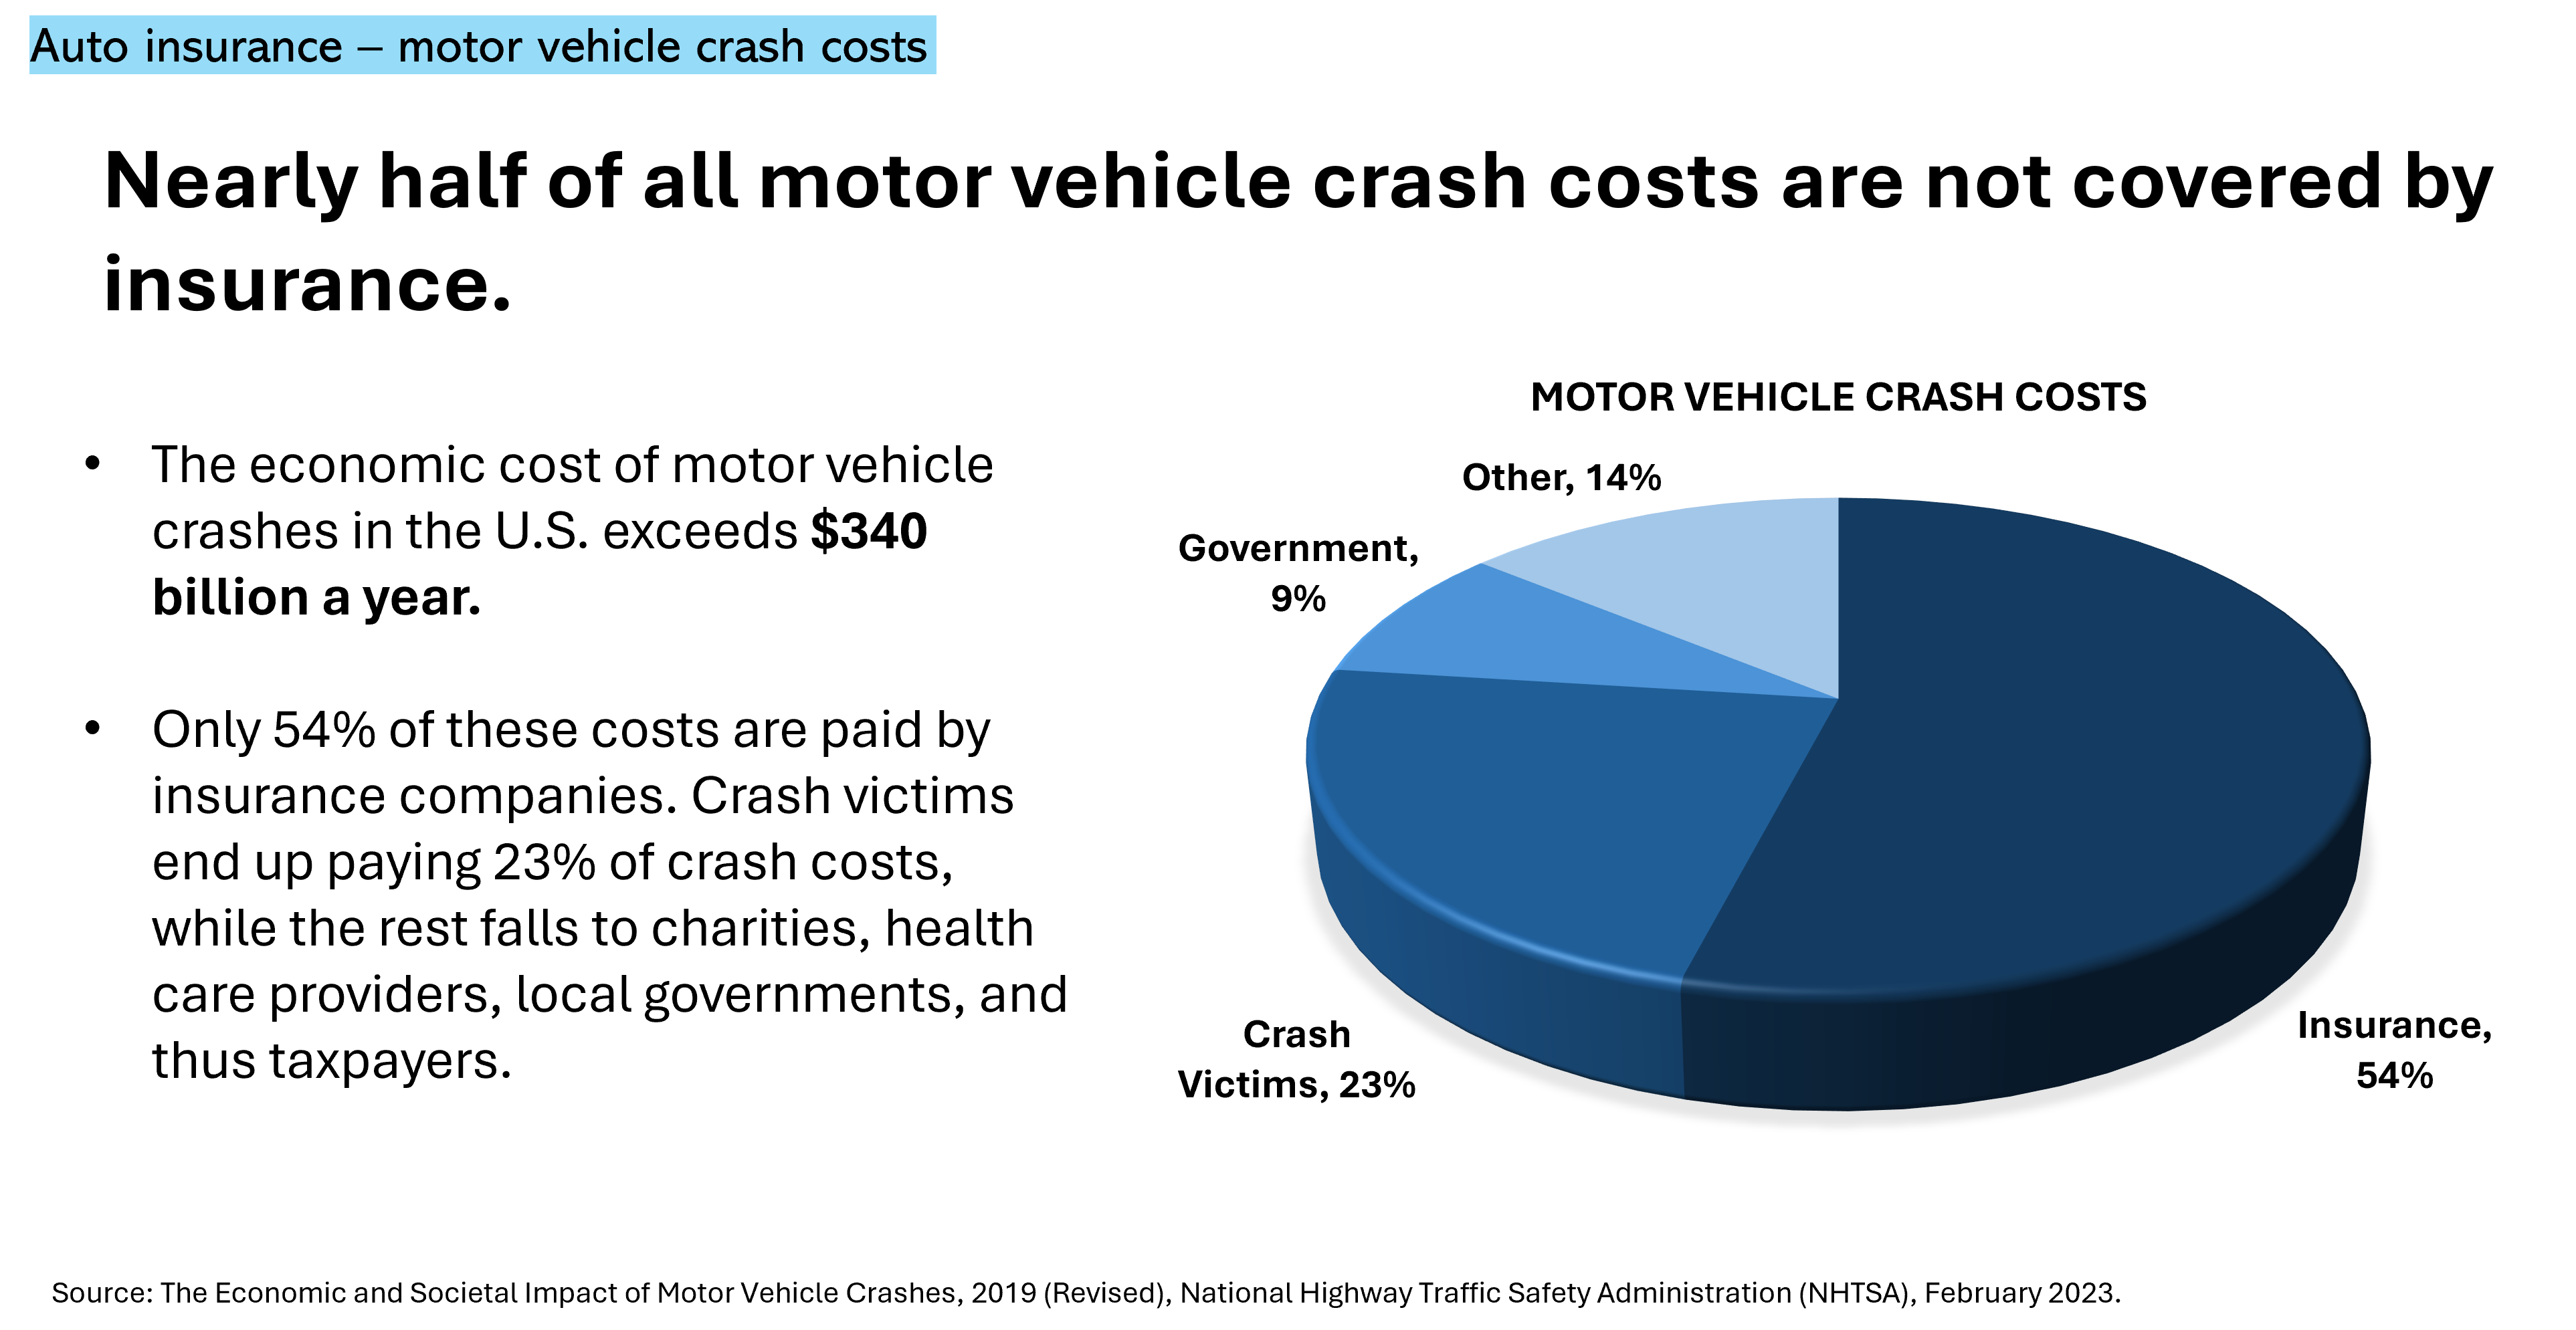
- Motor vehicle crash costs exceed $340 billion per year, only half of which is covered by insurance: Over 40,000 people are killed and more than 2 million are injured in motor vehicle crashes each year. The economic cost of these crashes exceeds $340 billion a year, but only 54% of these costs are paid by insurance companies. Crash victims, health care providers, charities, and local governments end up bearing the rest of the economic burden.
- Minimum levels of insurance are severely inadequate: Many states set their minimum levels of insurance decades ago and they have not been changed to reflect increases in medical care costs, increases in motor vehicle repair costs, or even inflation generally.
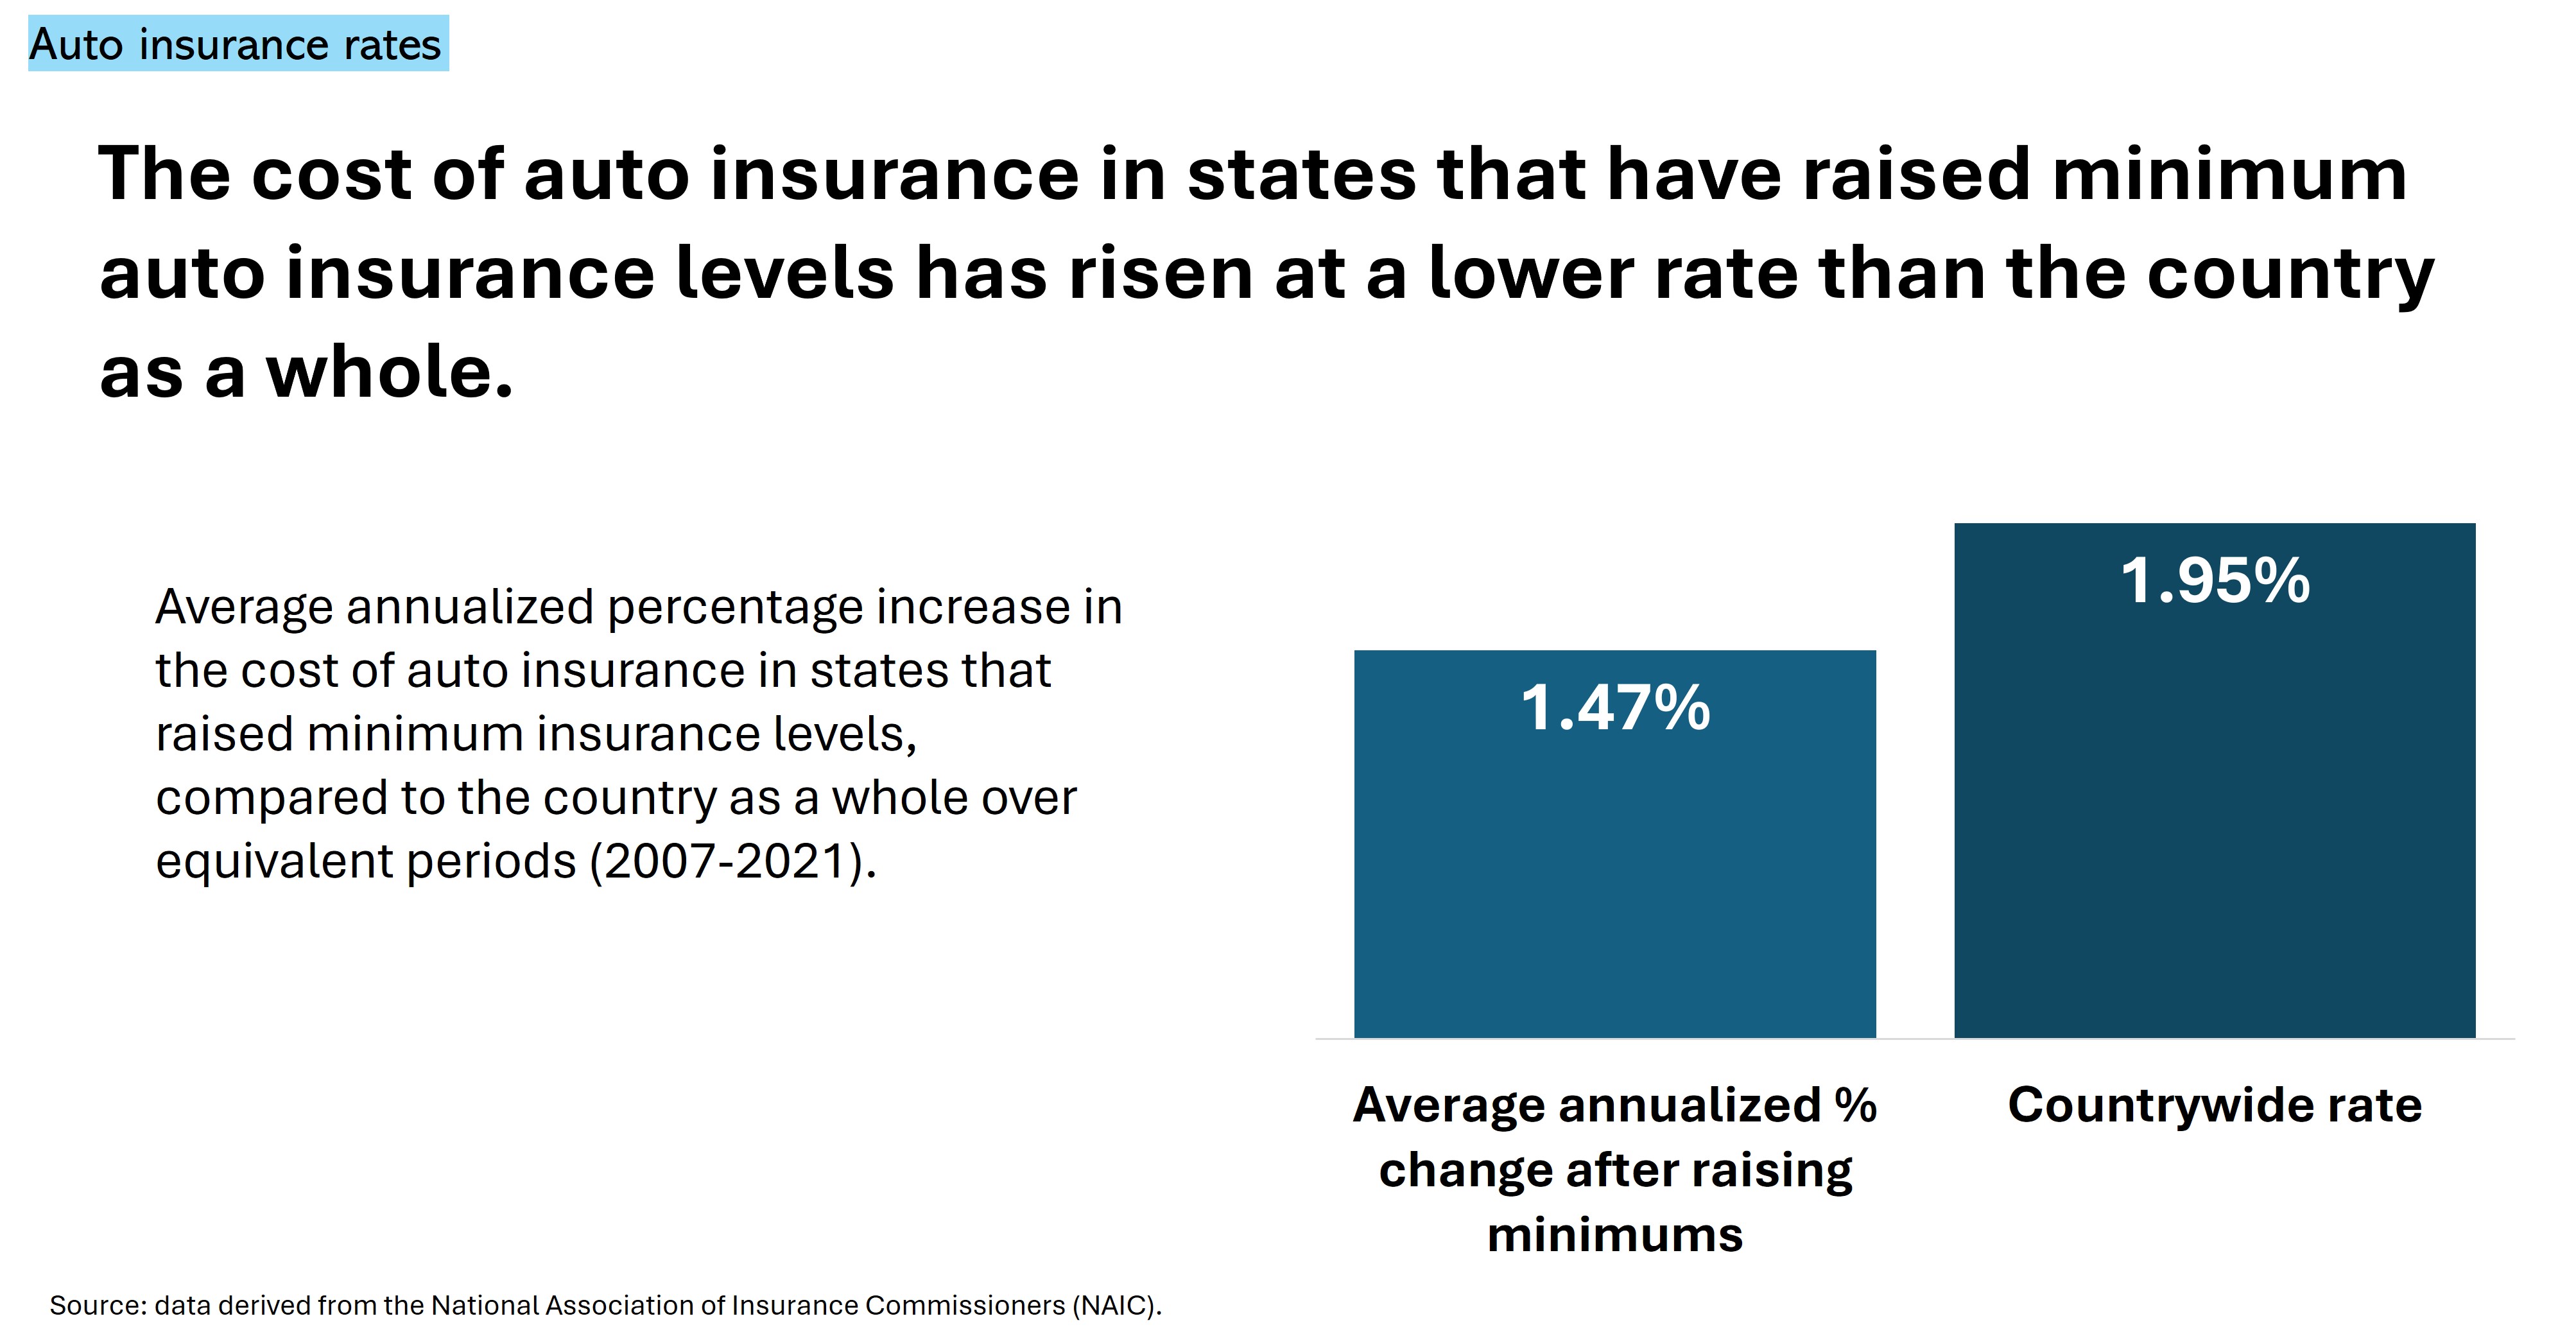
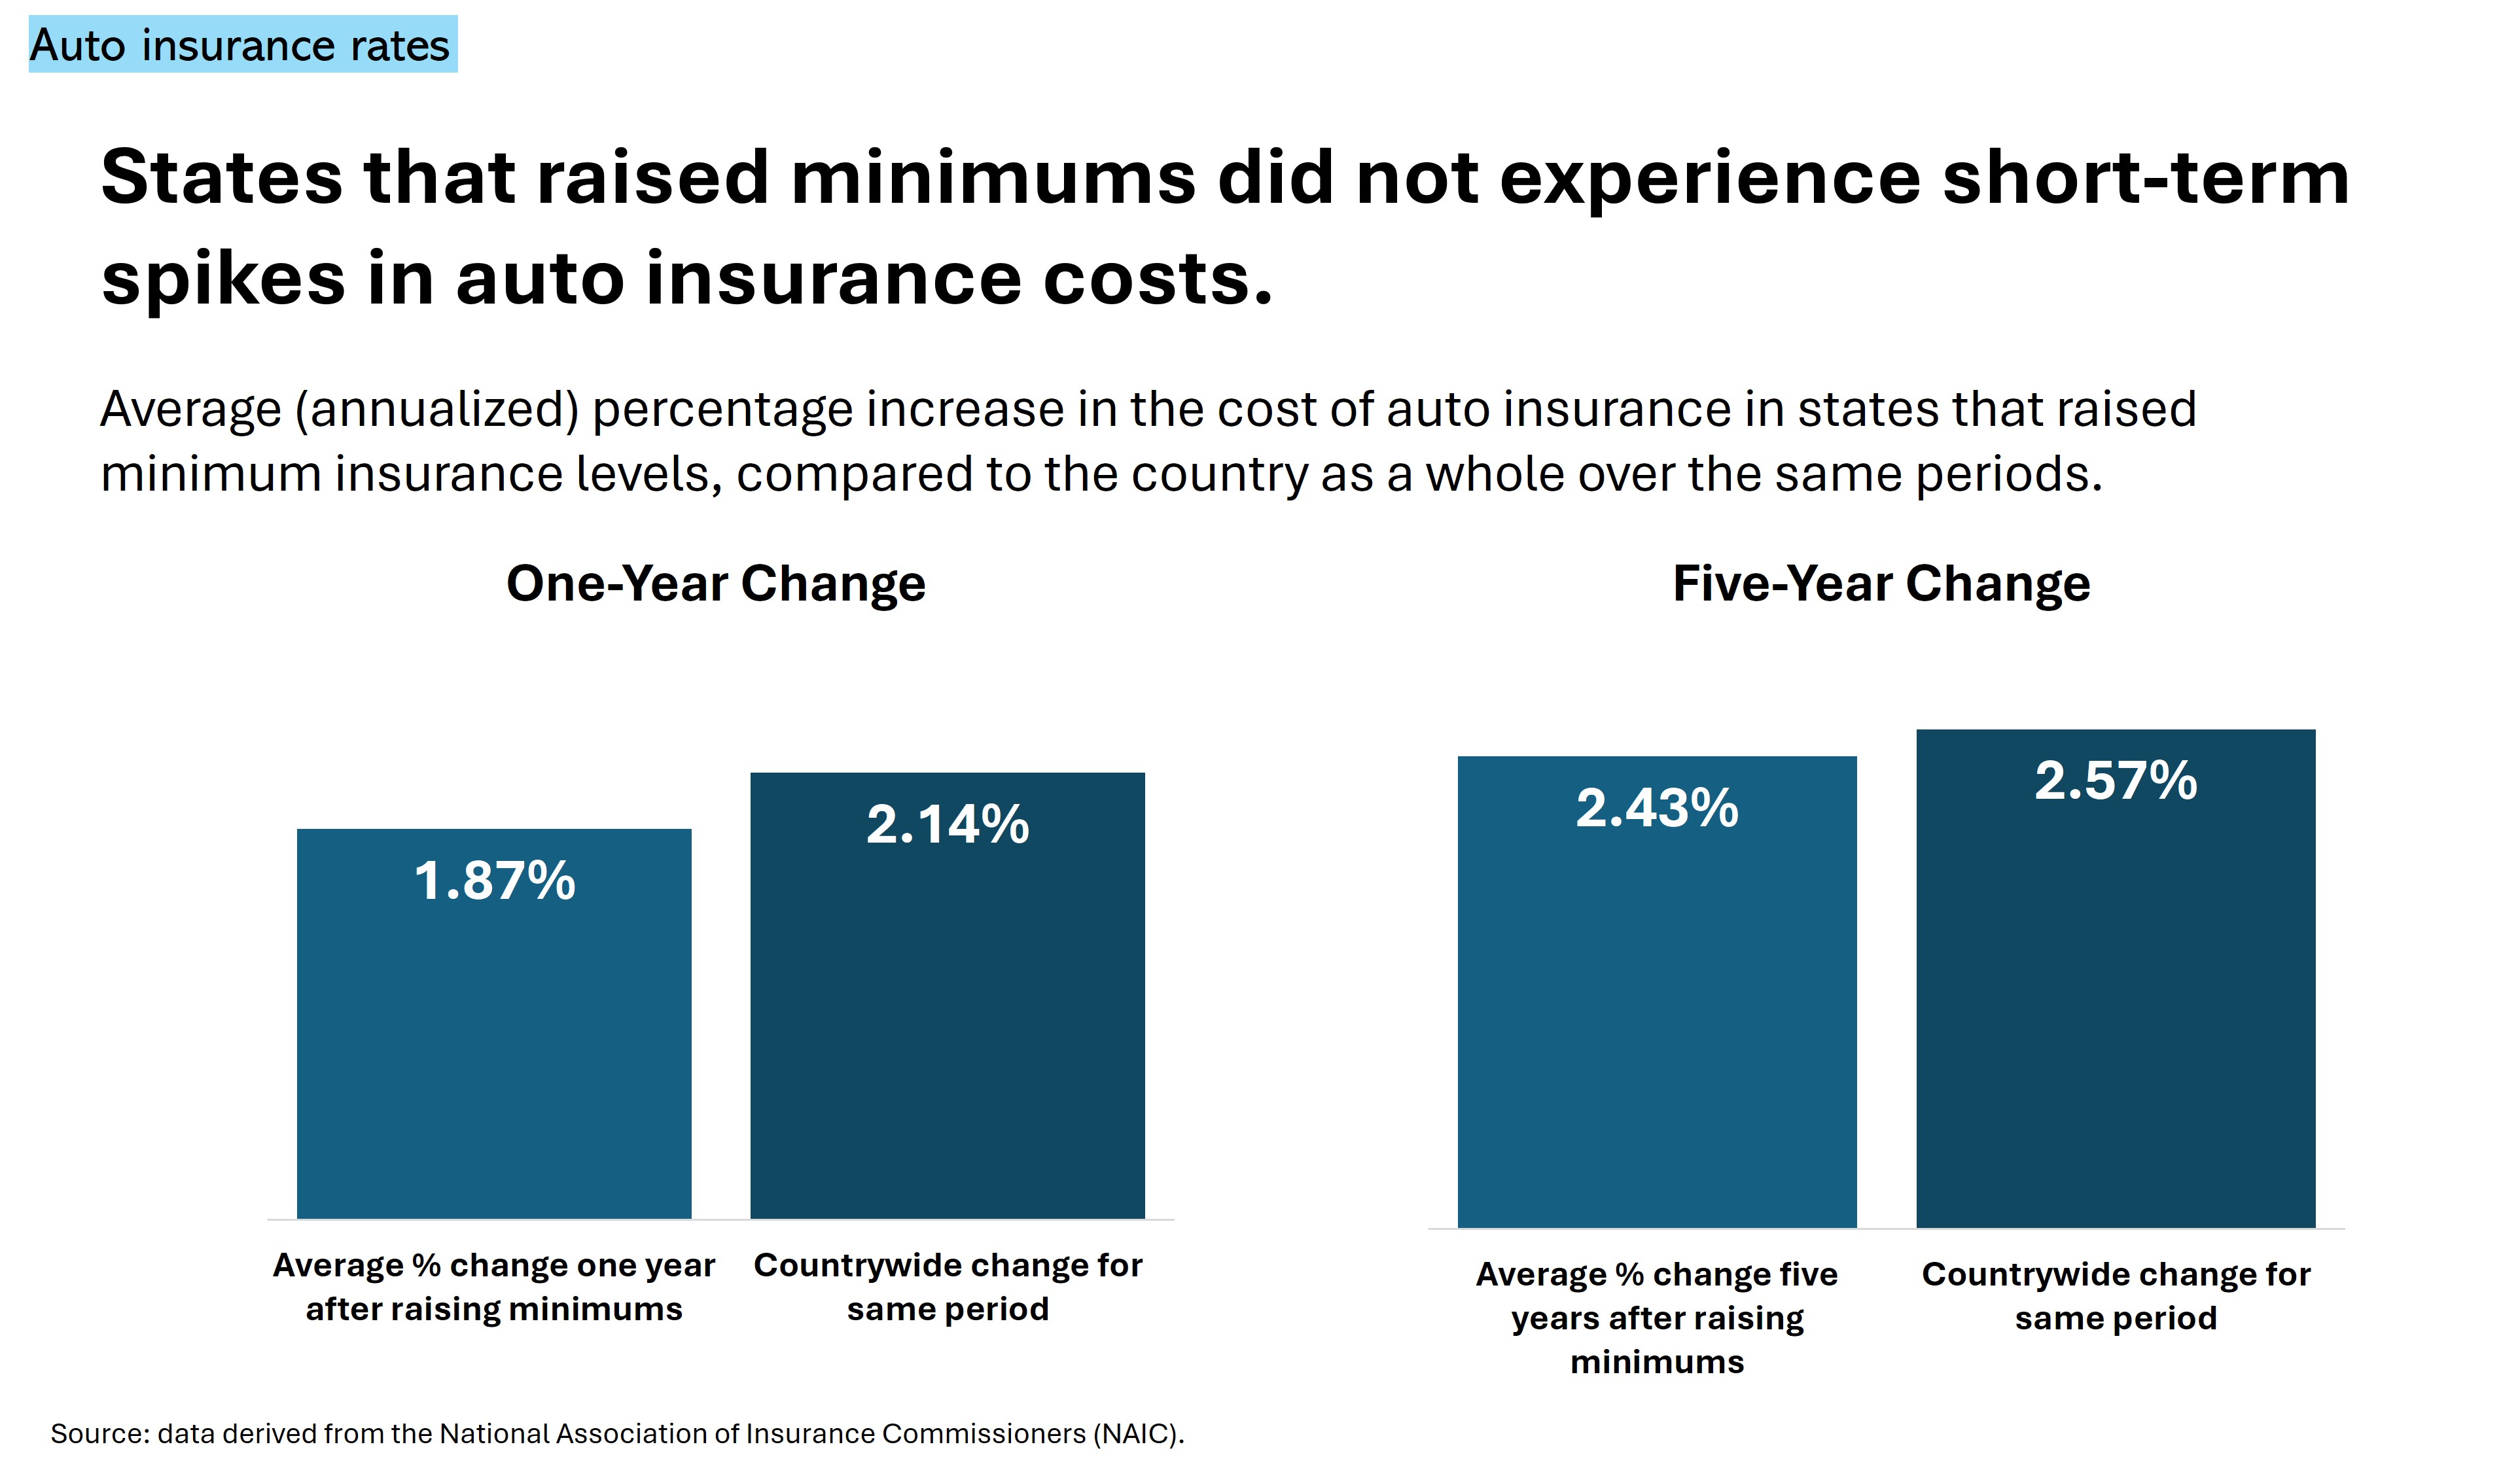
- Raising minimum insurance requirements does not increase drivers’ premiums: Despite fears that raising required minimum levels of insurance will increase premiums, states that have raised their minimum levels have seen the cost of auto insurance increase at a lower rate than the country as a whole over equivalent periods.3
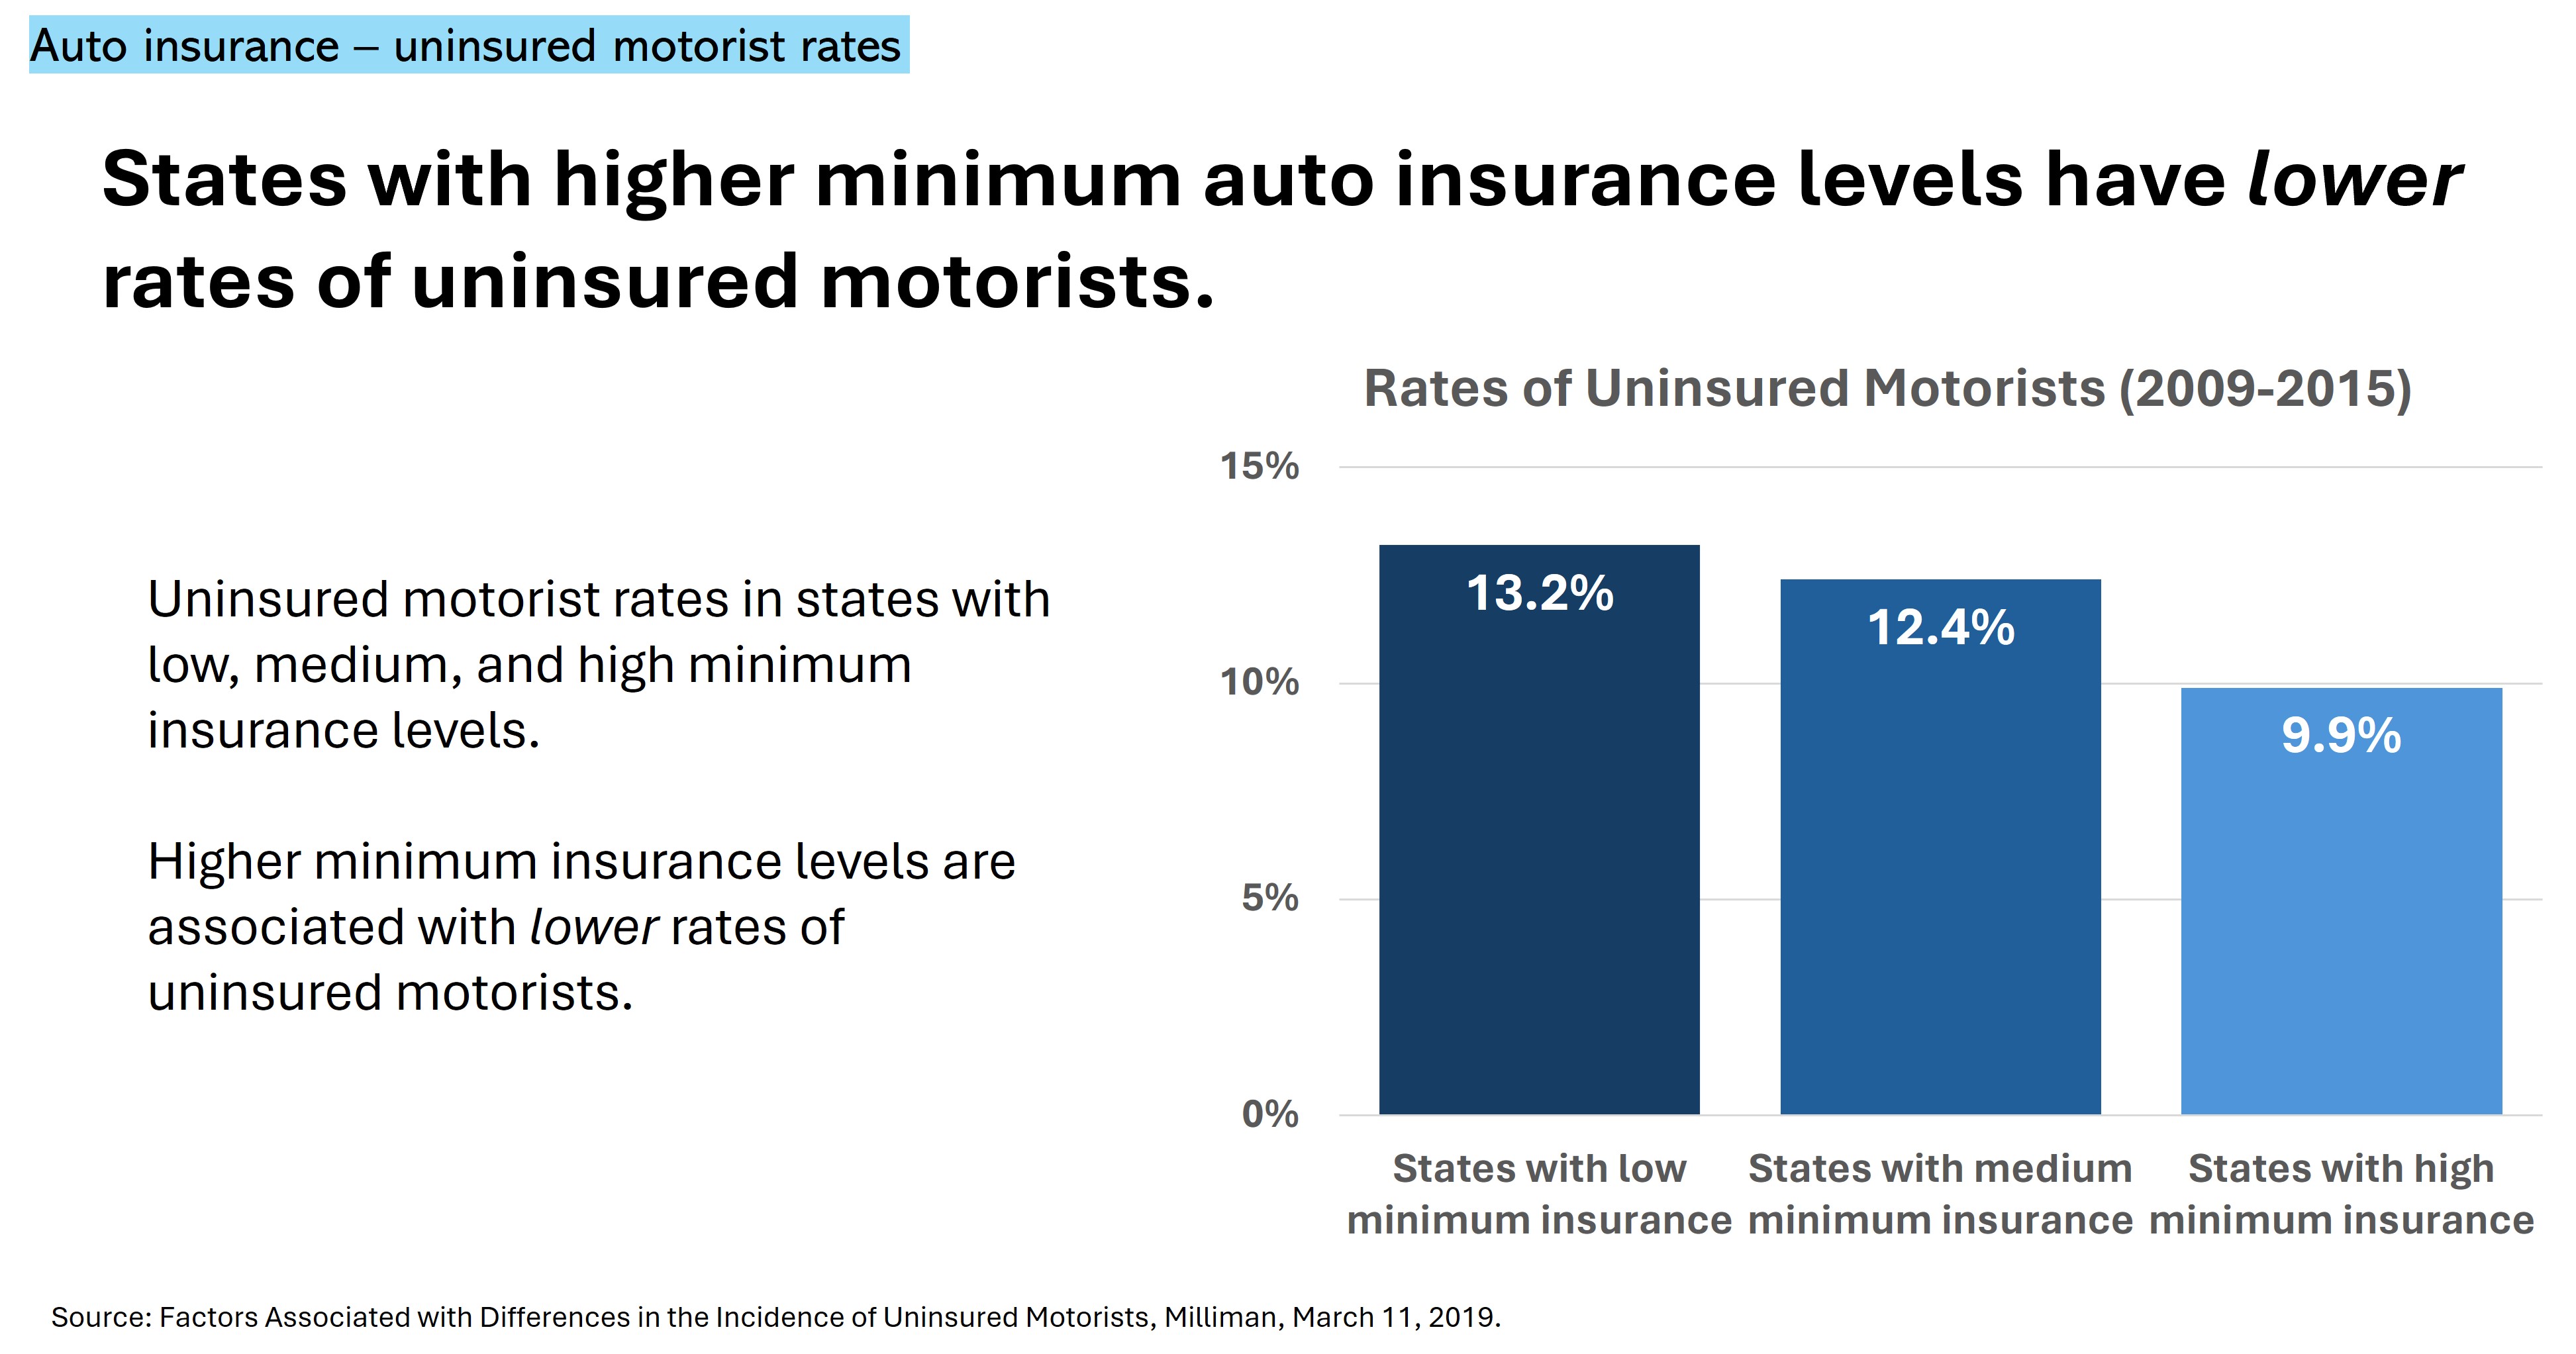
- Raising minimum levels of insurance does not increase the number of uninsured drivers: Higher minimum insurance levels are associated with lower rates of uninsured motorists. The majority of states that have raised minimums saw the proportion of uninsured drivers decrease.
- Increasing minimum insurance levels protects victims: Raising minimum insurance levels helps crash victims who would otherwise be left without full compensation for their losses and relieves the financial burden on health care providers, charities, local governments, and taxpayers.
Motor Vehicle Crash Costs Exceed $340 Billion per Year, Only Half of Which is Covered by Insurance
In 2022, 42,500 people were killed in motor vehicle crashes, and another 2.4 million were injured. In 2019, the economic cost of such motor vehicle crashes in the U.S. exceeded $340 billion a year—a 40% increase since 2010. 1
In 48 states and the District of Columbia, vehicle owners are required by law to purchase auto insurance to protect themselves and others in case of a crash. The minimum levels of insurance are set by each state and are comprised of three amounts: bodily injury or death of one person, bodily injury or death of two or more persons, and property damage. Florida has the lowest minimum requirements ($10,000/$20,000/$10,000) while Alaska and Maine have the highest ($50,000/$100,000/$25,000).
However, in most states these minimum levels were set decades ago and are now severely inadequate. Only 54% of $340 billion in motor vehicle crash costs was paid by insurance companies. Crash victims end up paying 23% of crash costs, while the rest falls to charities, health care providers, local governments, and thus taxpayers.
Minimum Levels of Insurance are Severely Inadequate
Part of the problem is outdated minimum insurance levels in many states, which haven’t been adjusted for decades. Many of these minimums were established in the 1970s and haven’t kept pace with the rising costs of medical care, vehicle repairs, or inflation.
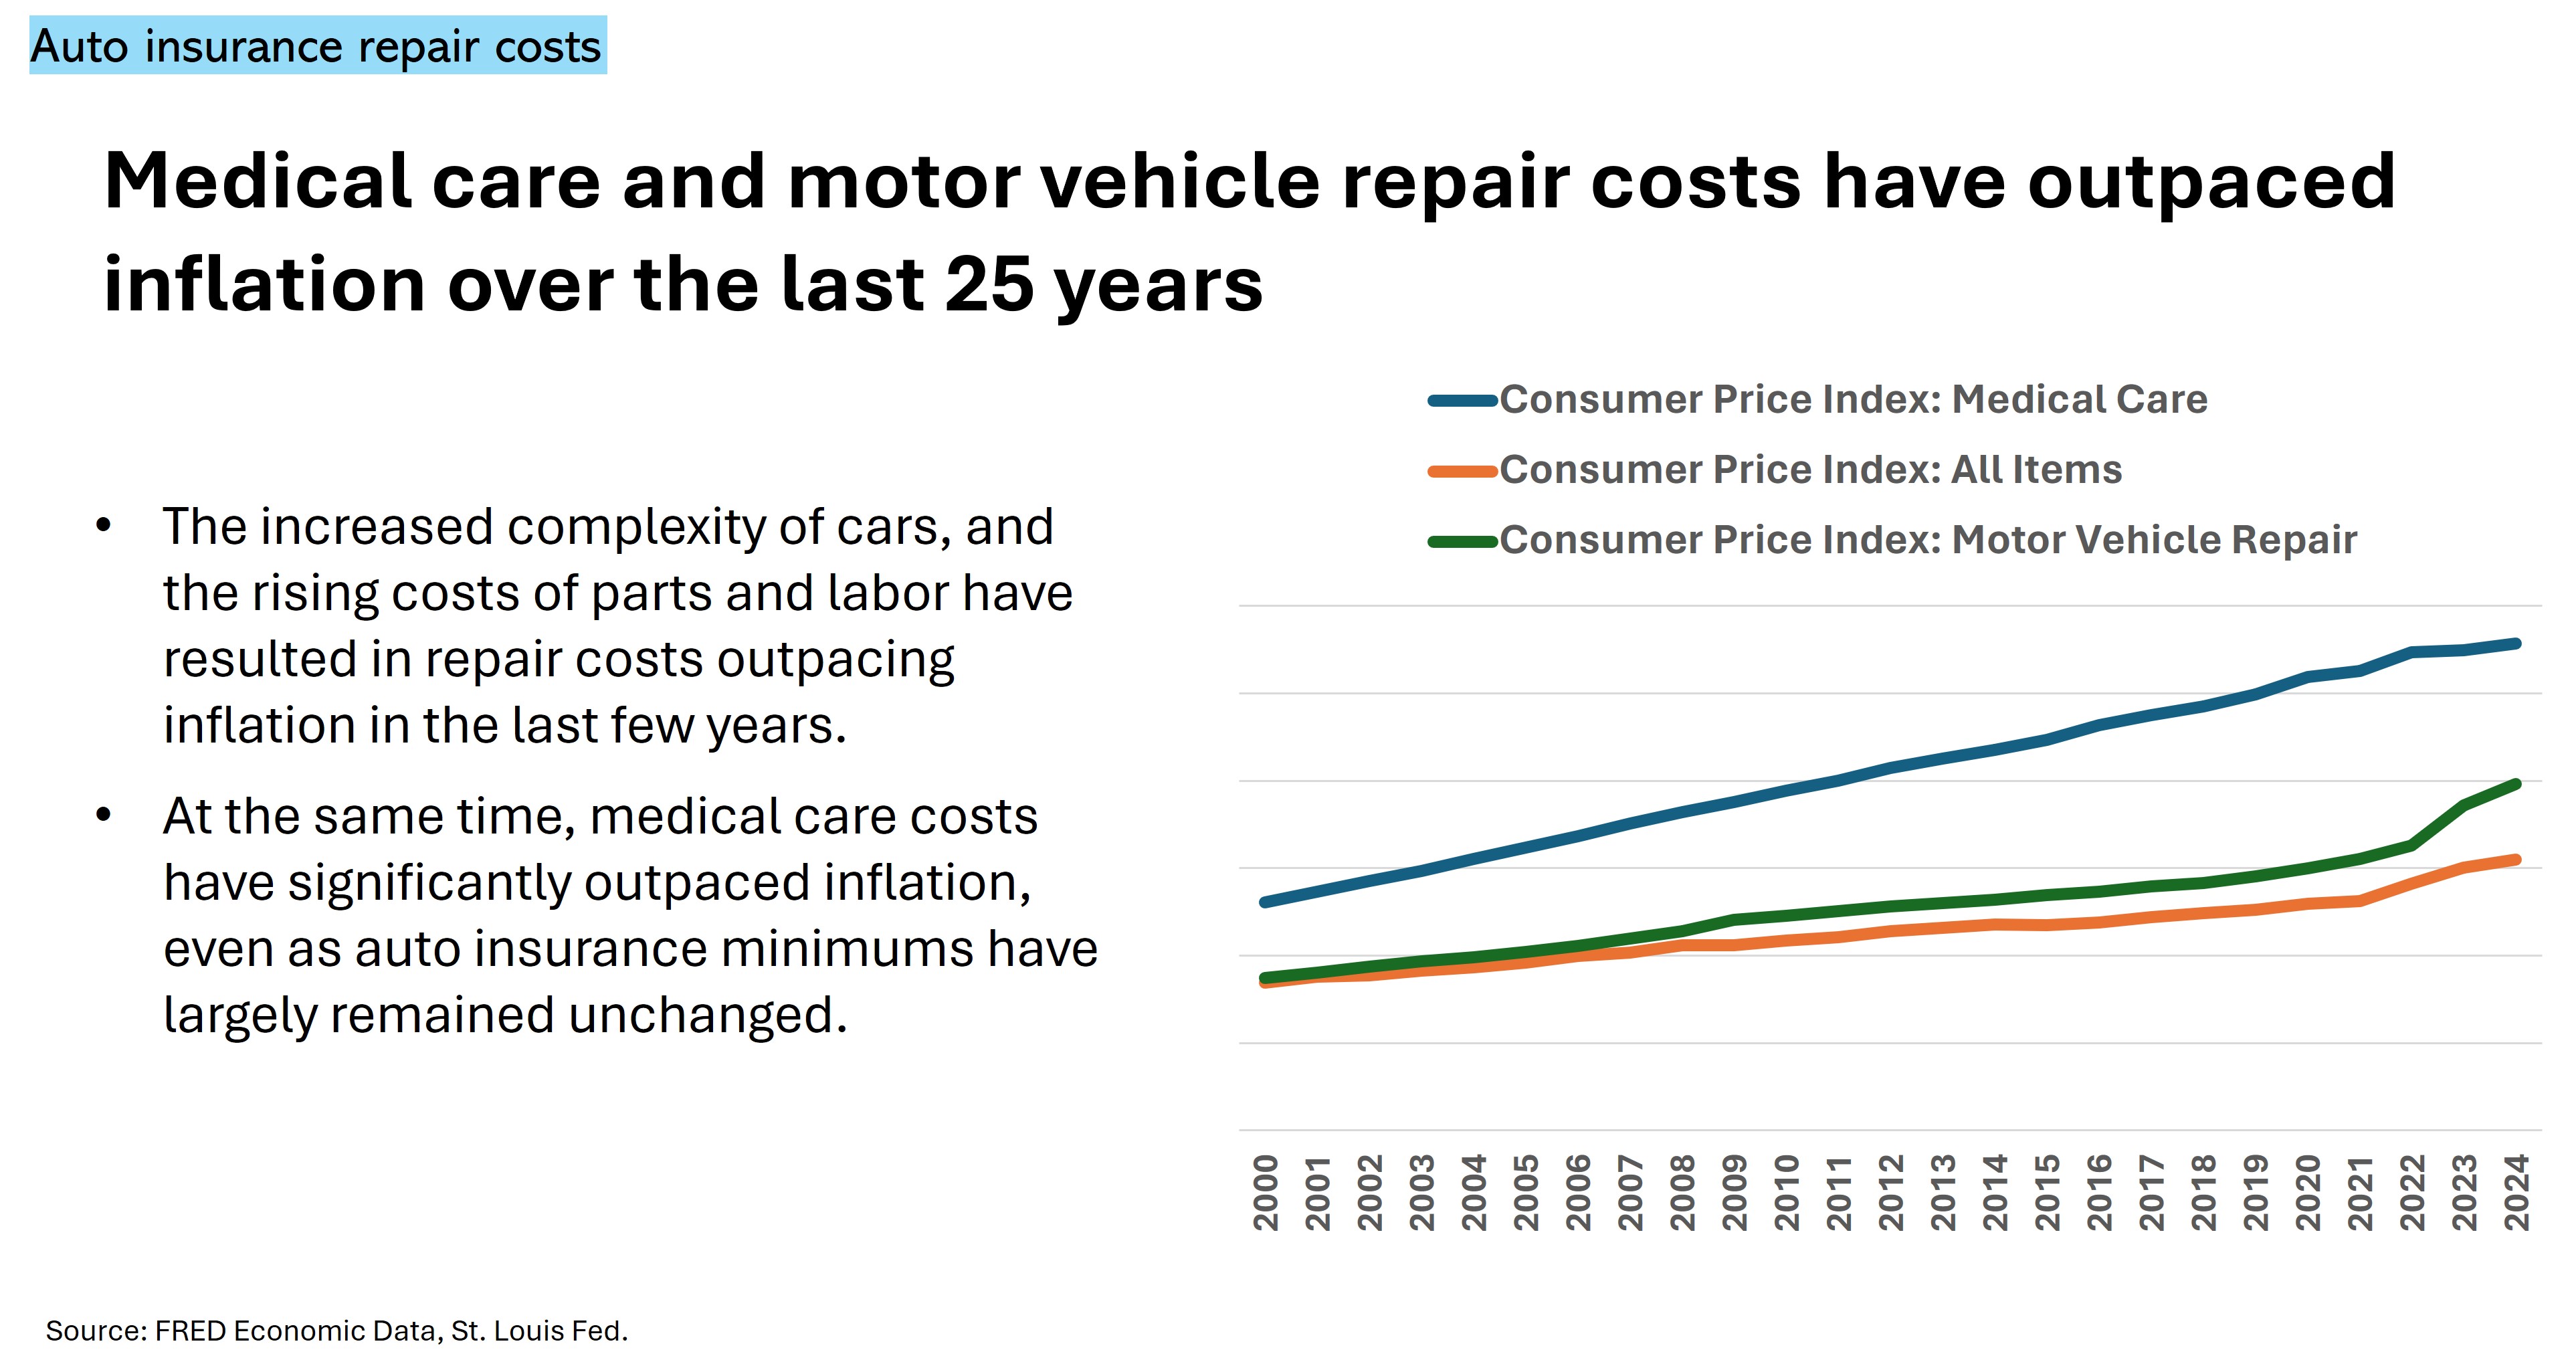
Minimum insurance levels have stayed largely the same even as the costs of medical care, vehicle repair, and property damage have increased. The result is that drivers involved in motor vehicle crashes do not have enough coverage to cover the costs of crashes. Drivers deemed at fault in a crash may then find themselves having to pay out of their own pocket to cover the difference between their insurance and the other driver’s expenses, or the injured parties themselves may be left to cover the costs of a damaged vehicle, medical bills, and lost wages.
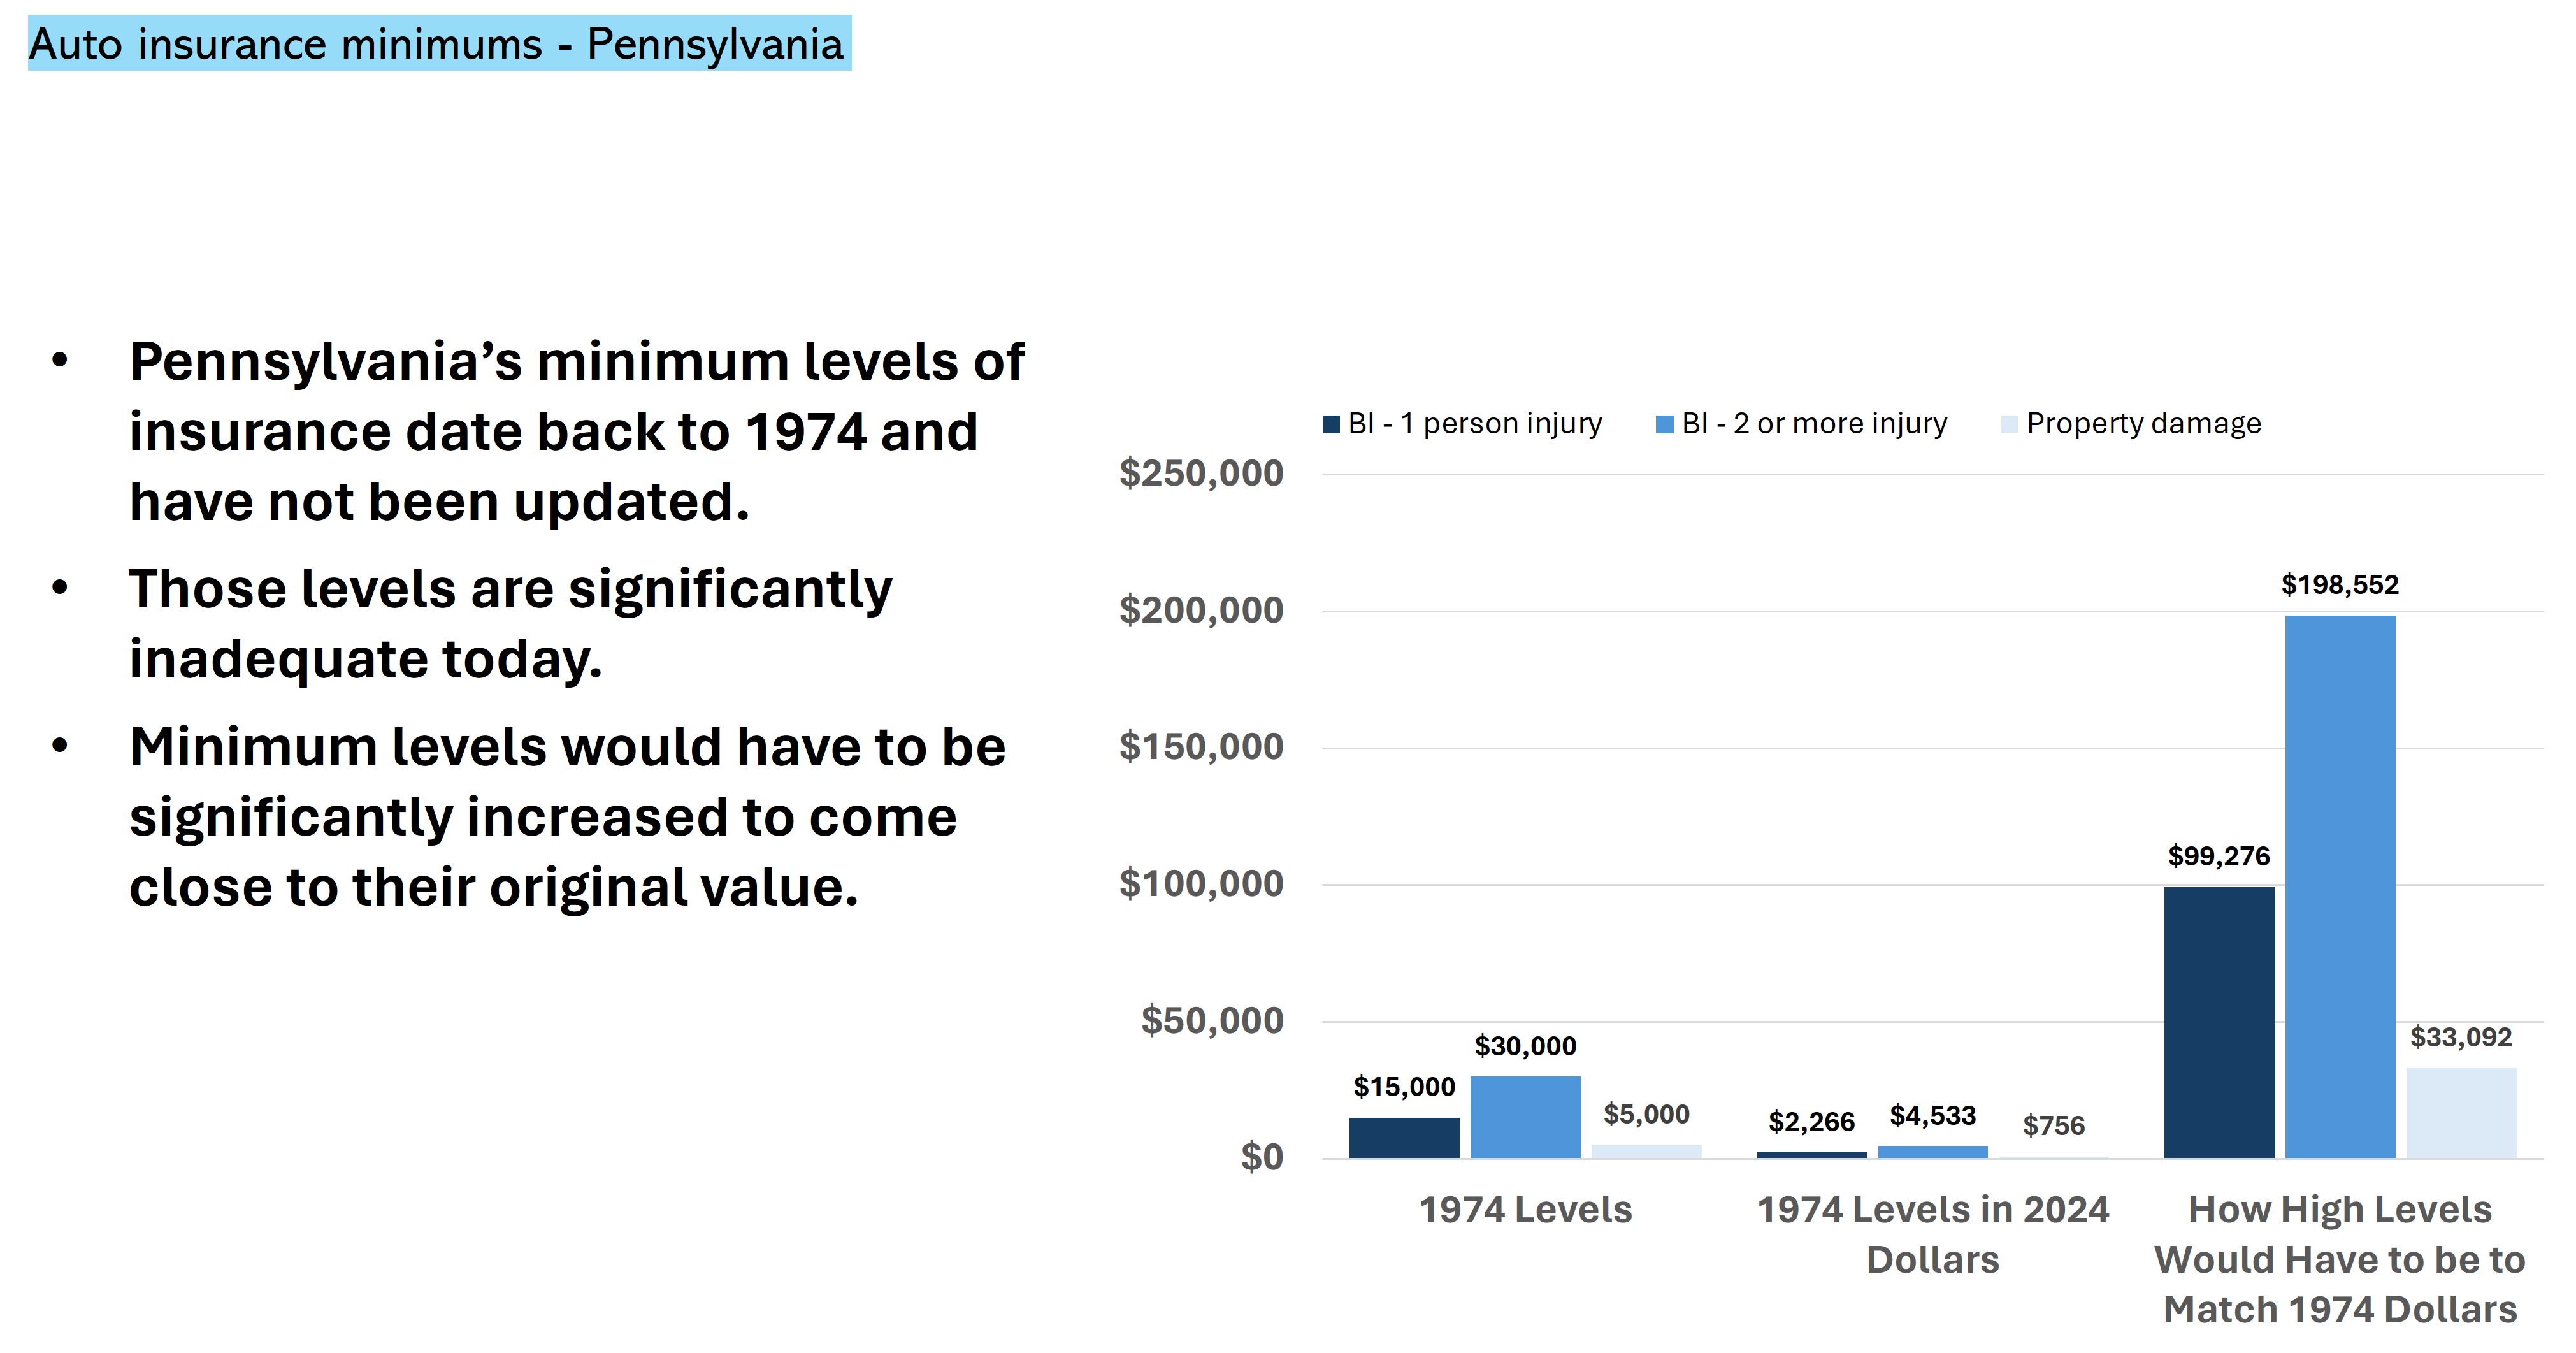
Pennsylvania’s minimum insurance levels (bodily injury or death of one person-$15,000 / bodily injury or death of two or more persons-$30,000 / and property damage-$5,000) were set in 1974, for example. At the time, a Hershey’s bar was 15 cents, a loaf of bread was 33 cents, the average car cost just under $5,000, and the average house just $36,000.2
Raising Minimum Levels of Insurance Does Not Increase Insurance Premiums
Lawmakers are often reluctant to increase minimum levels of insurance because of the fear that insurance premiums may increase dramatically. However, drivers in states that have raised their minimum insurance levels have not experienced spikes in their auto insurance premiums.
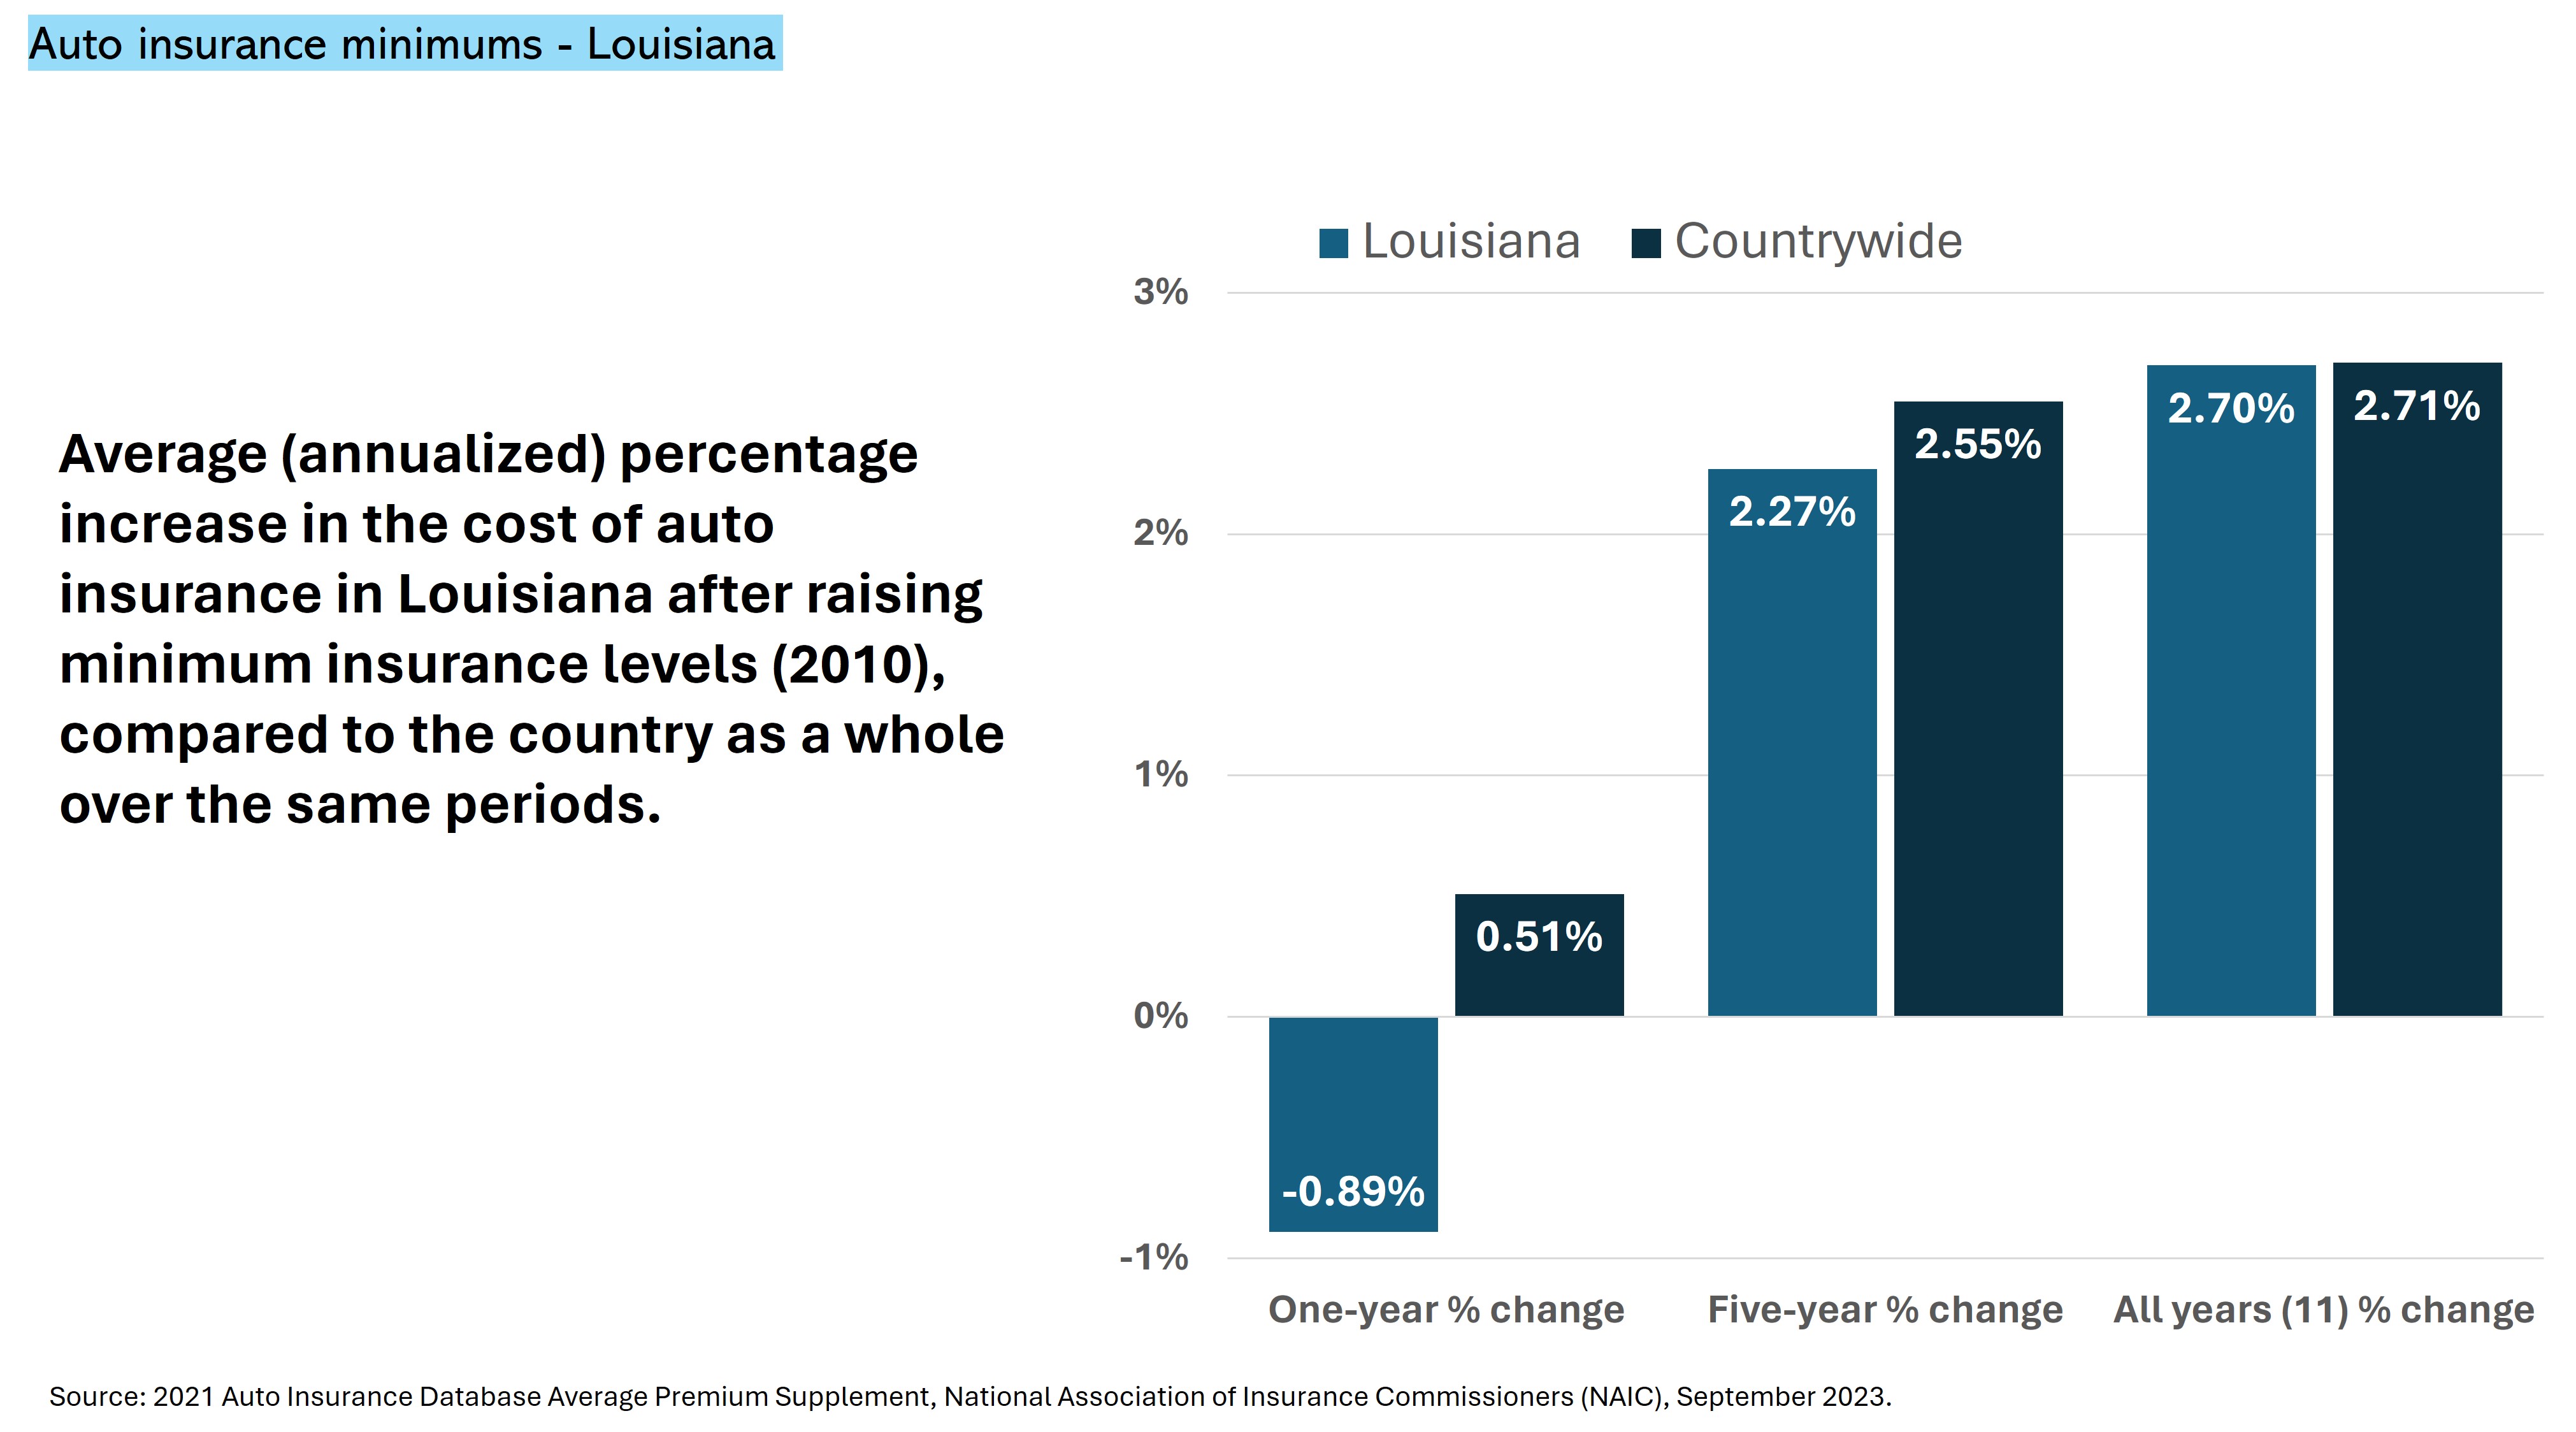
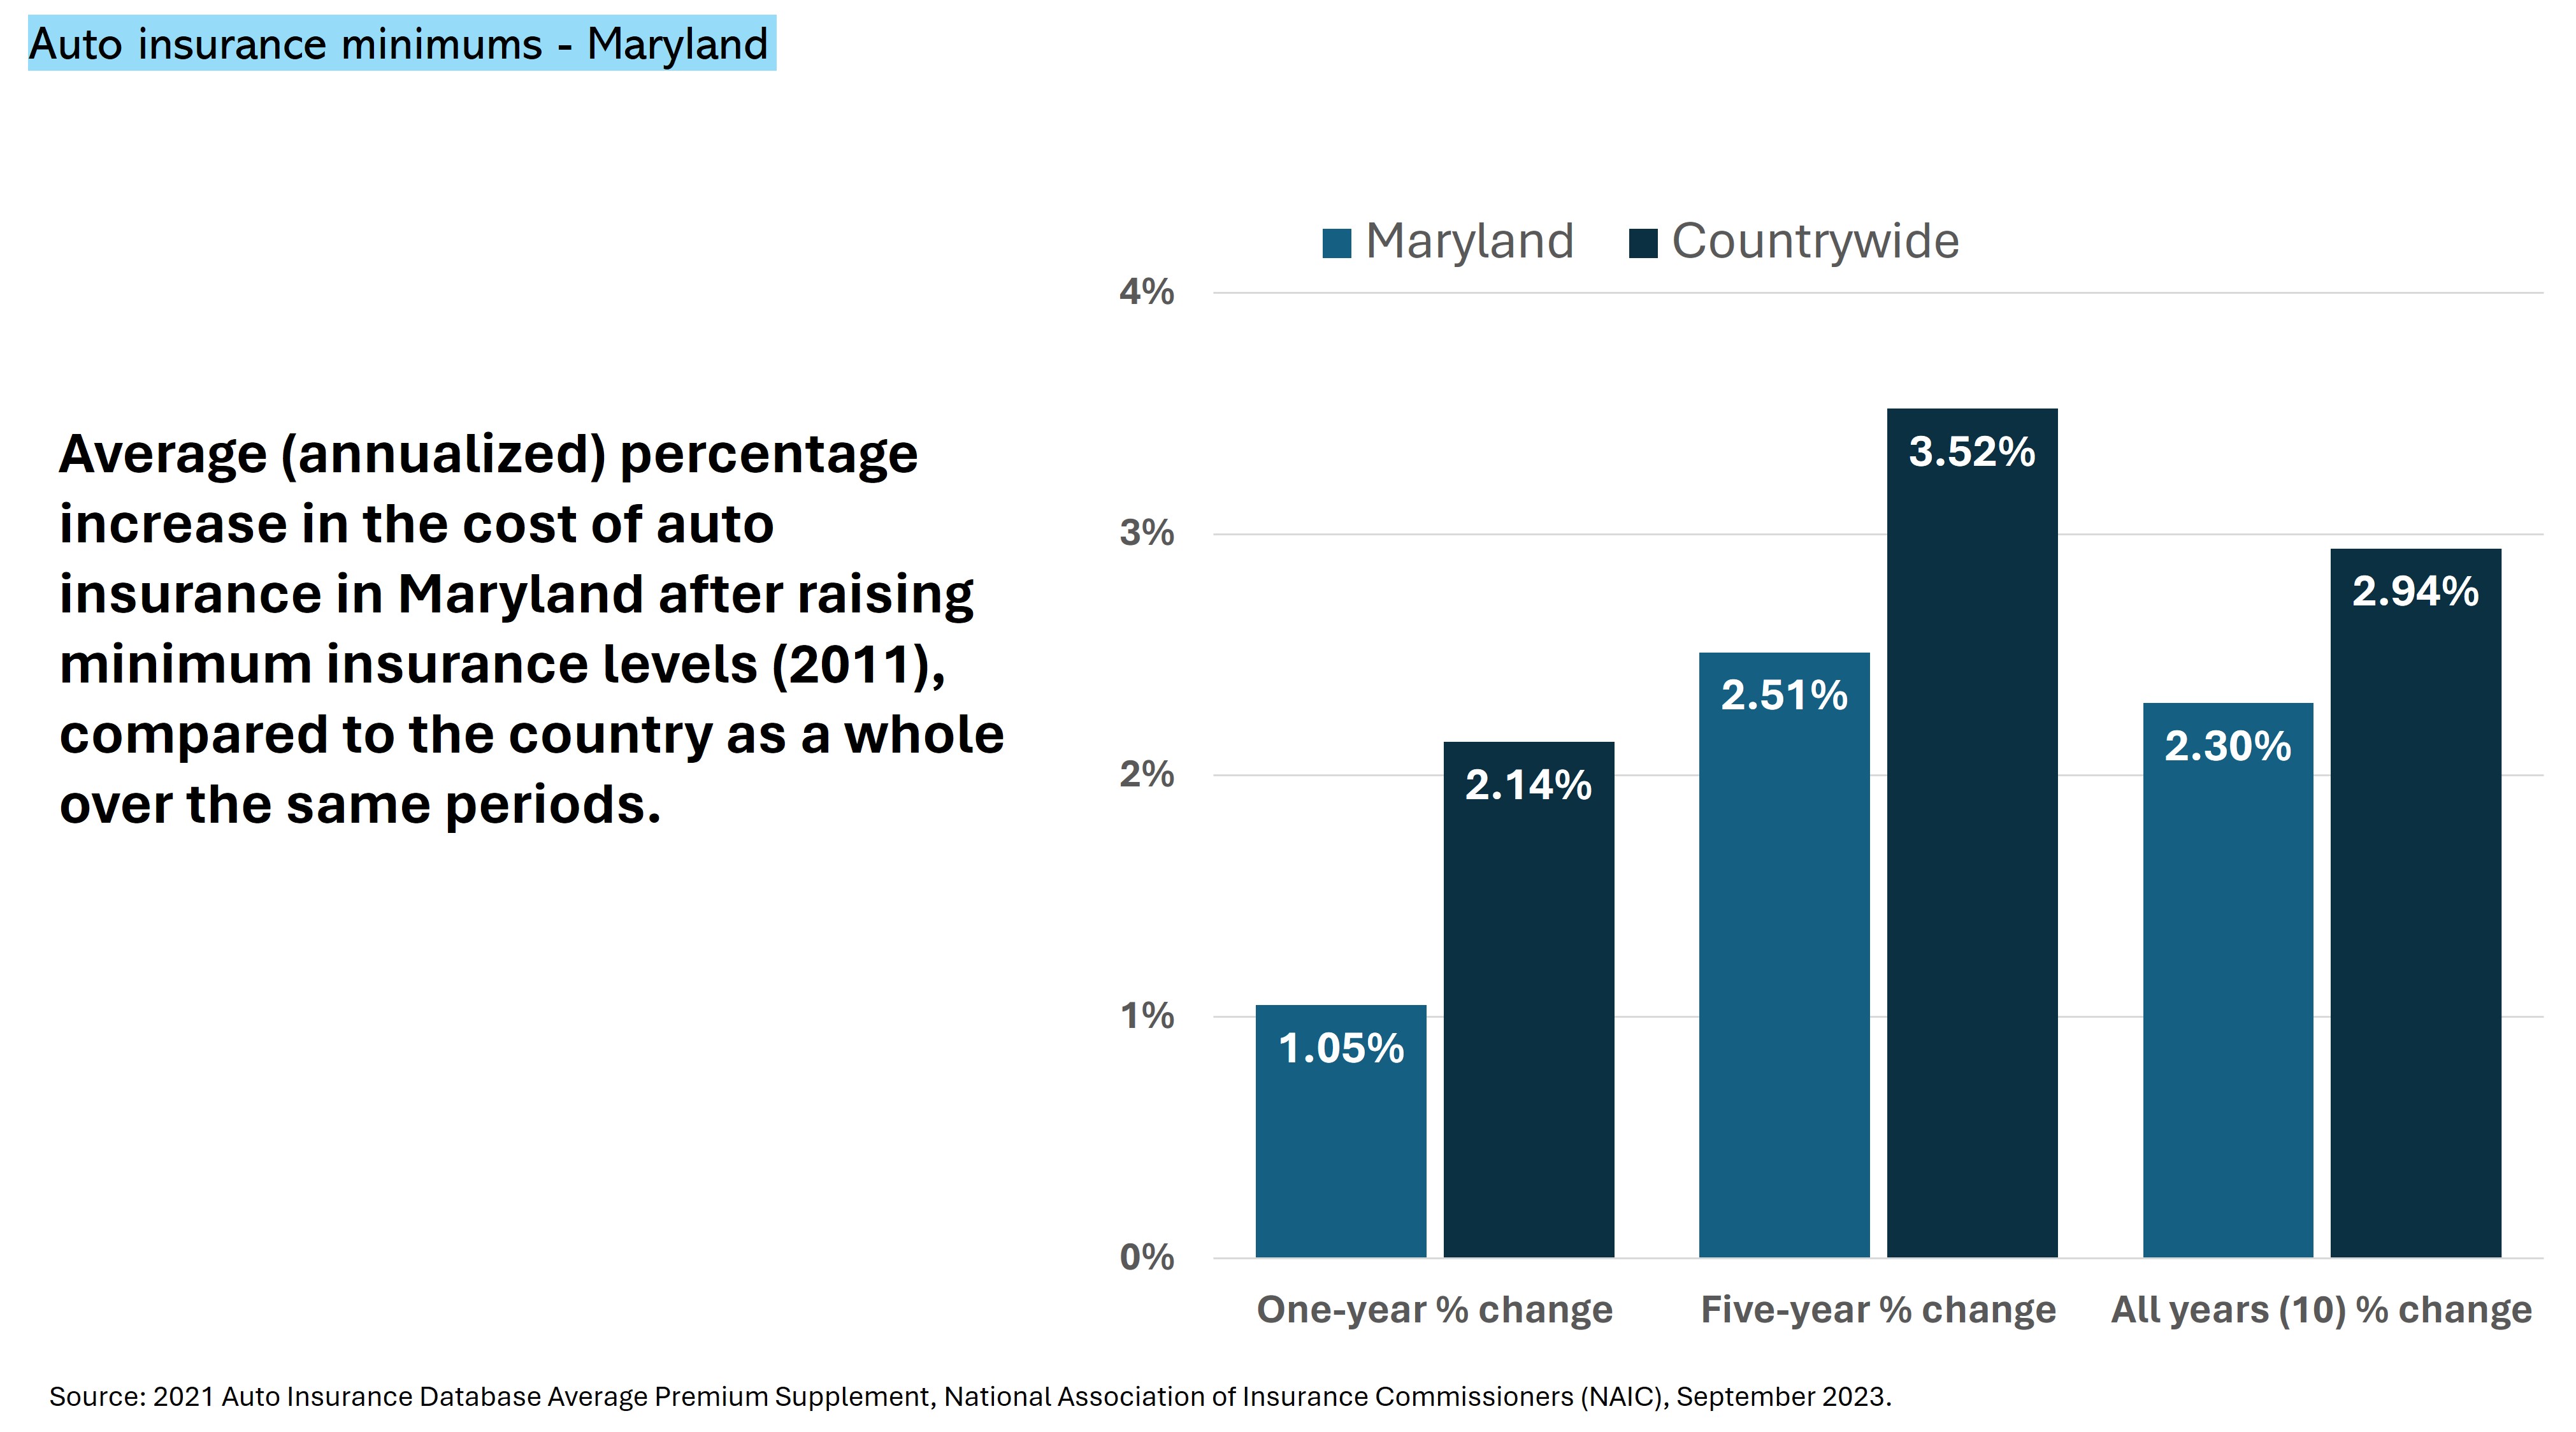
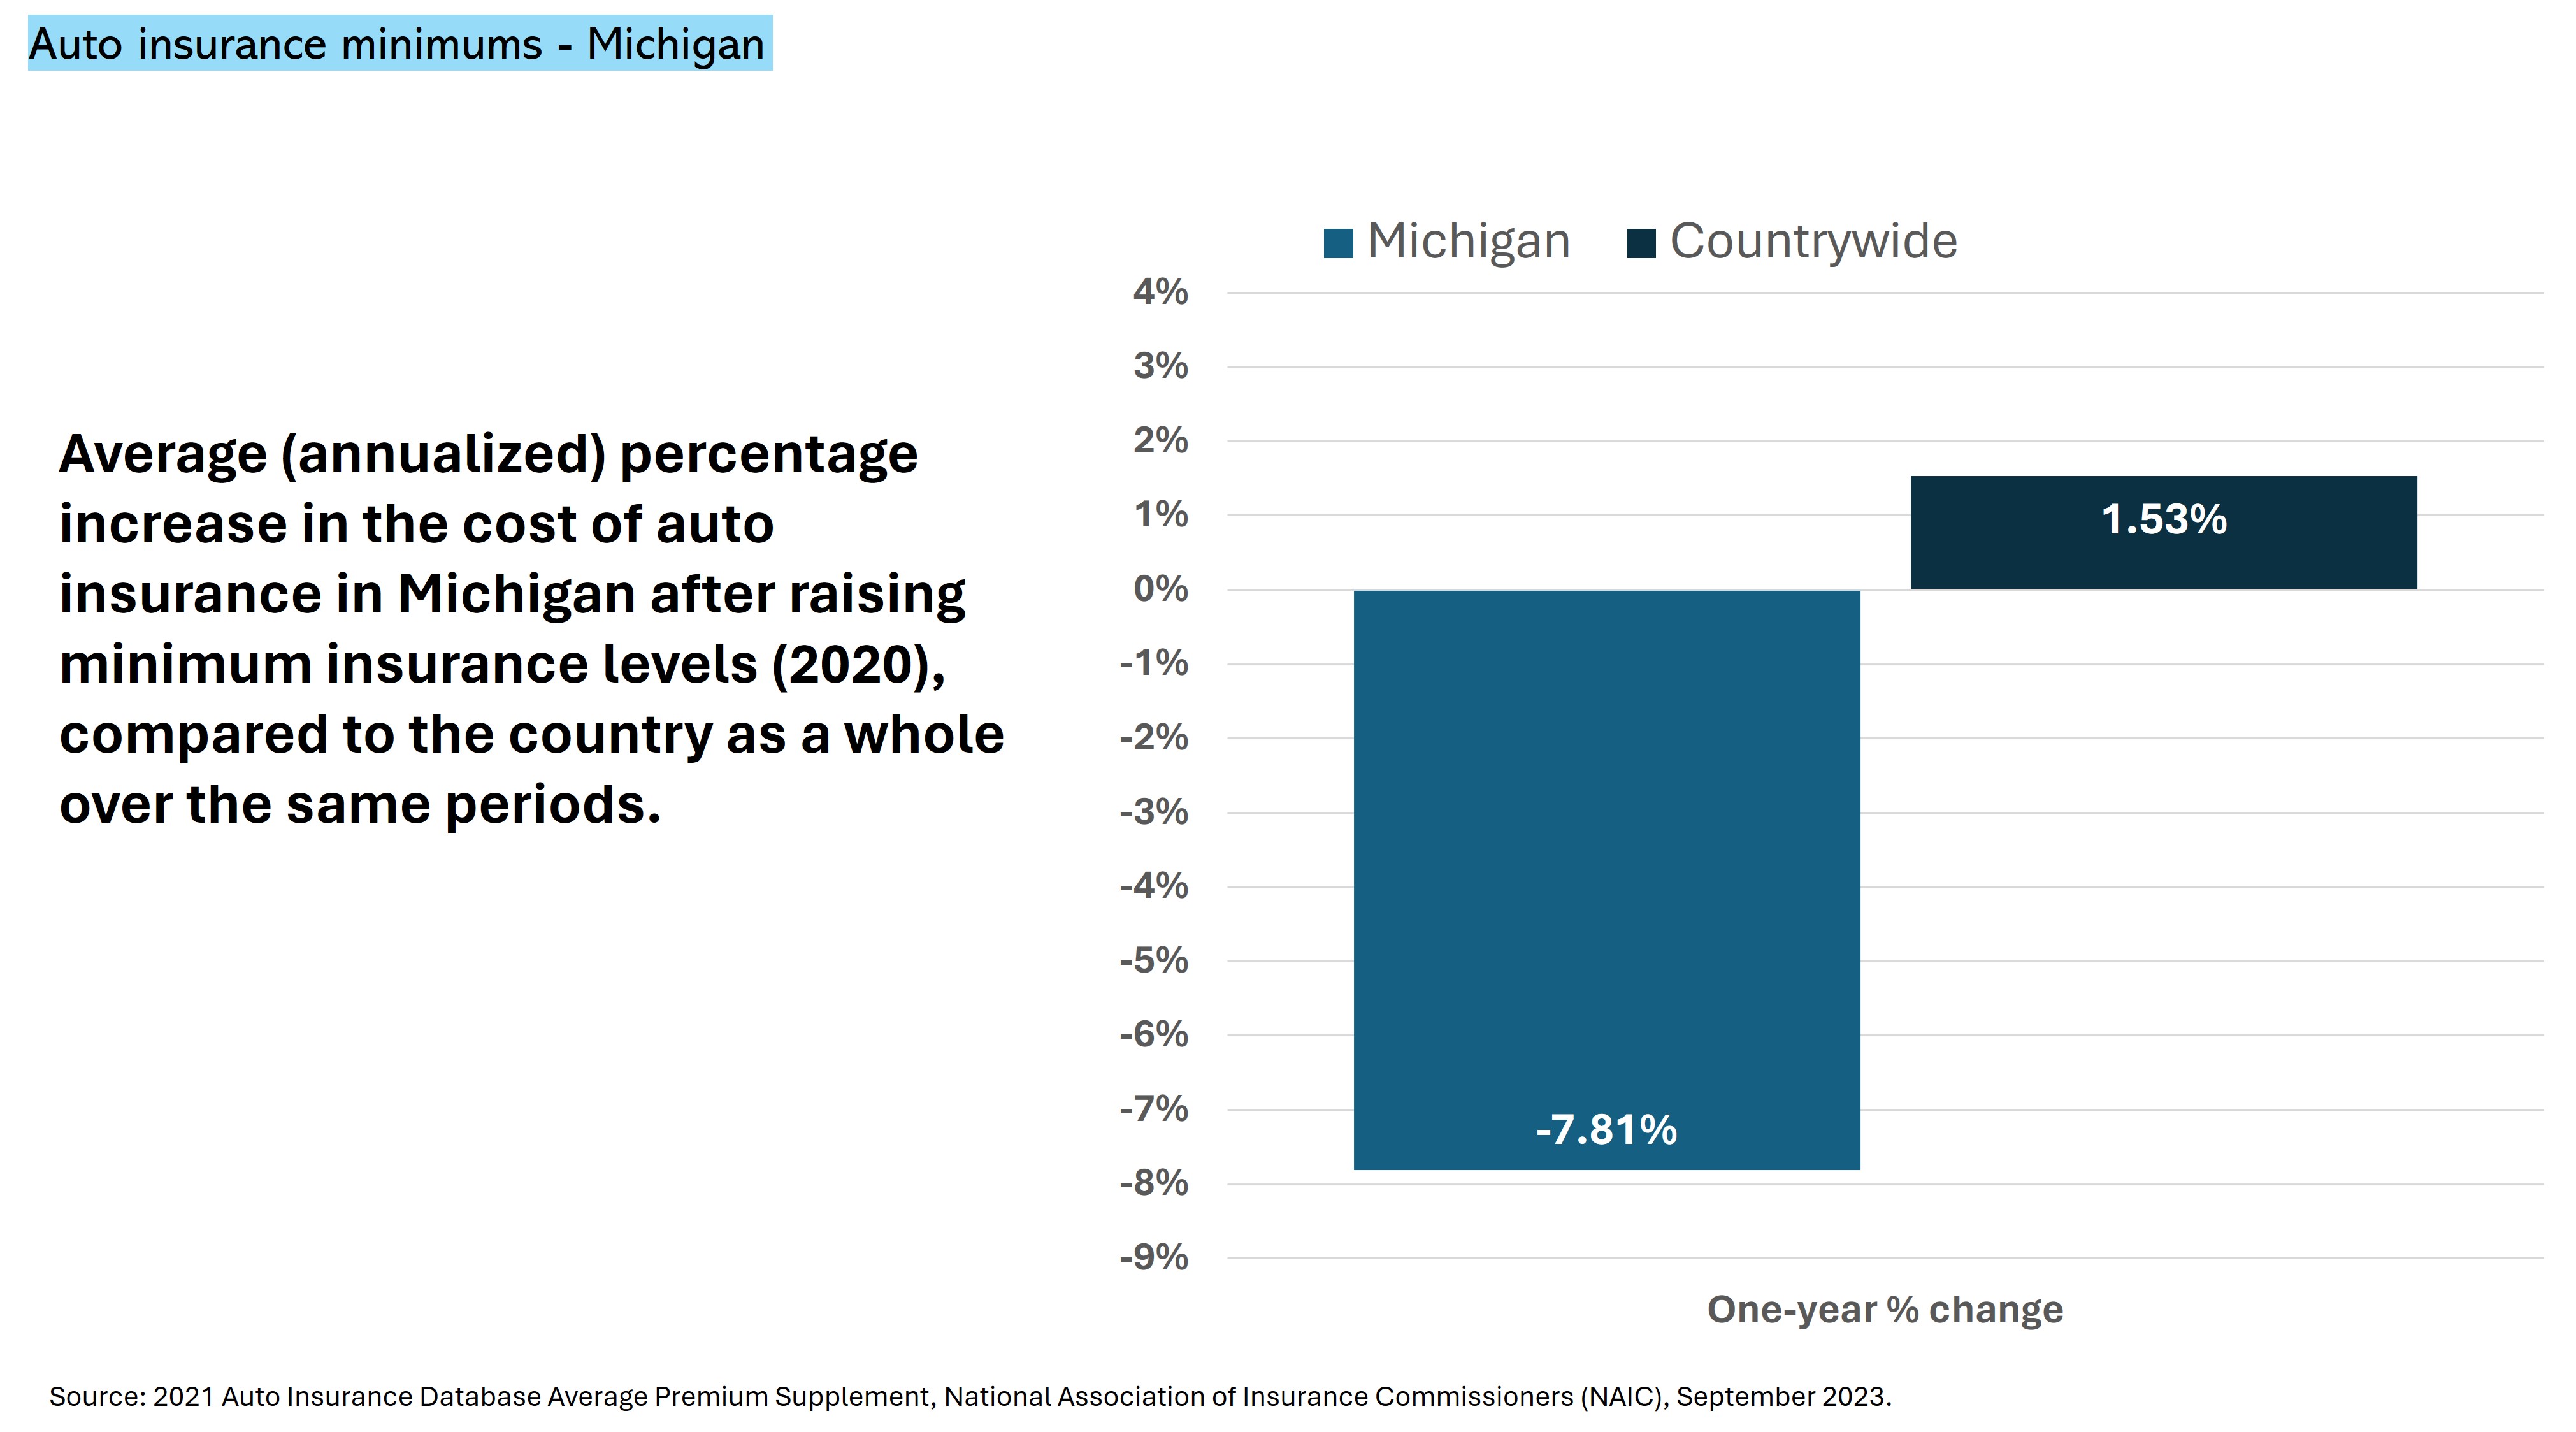
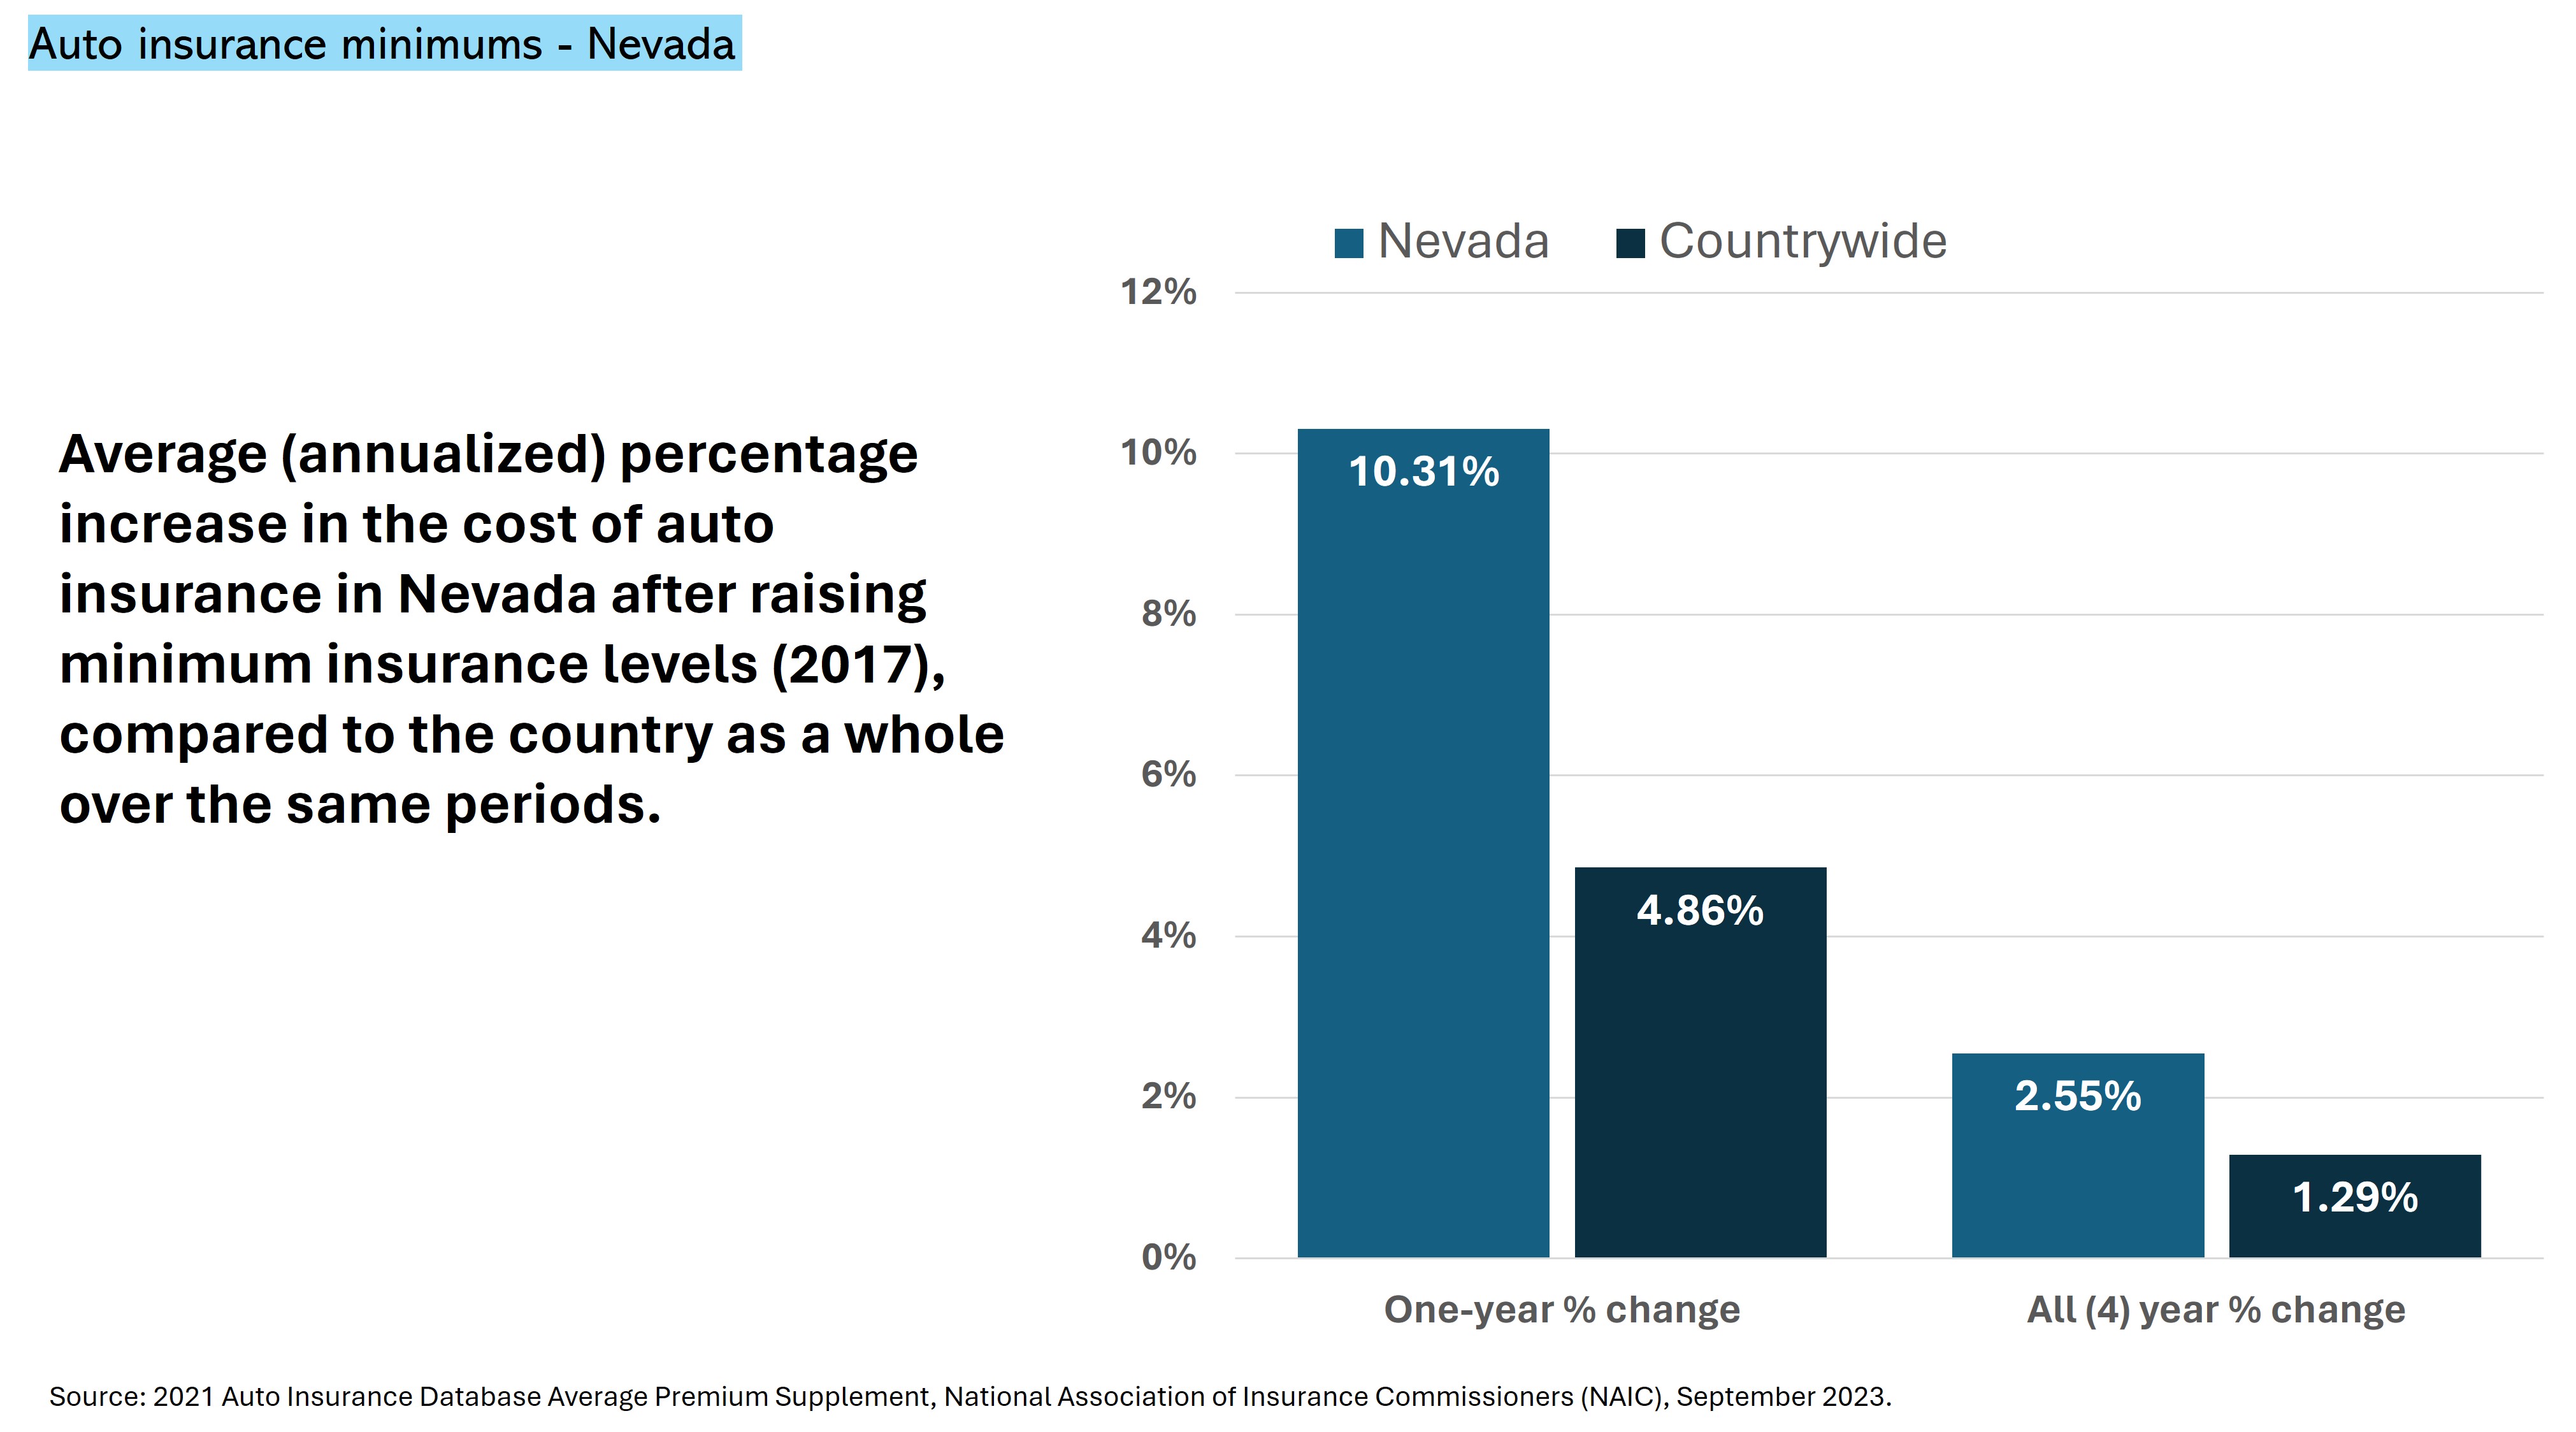
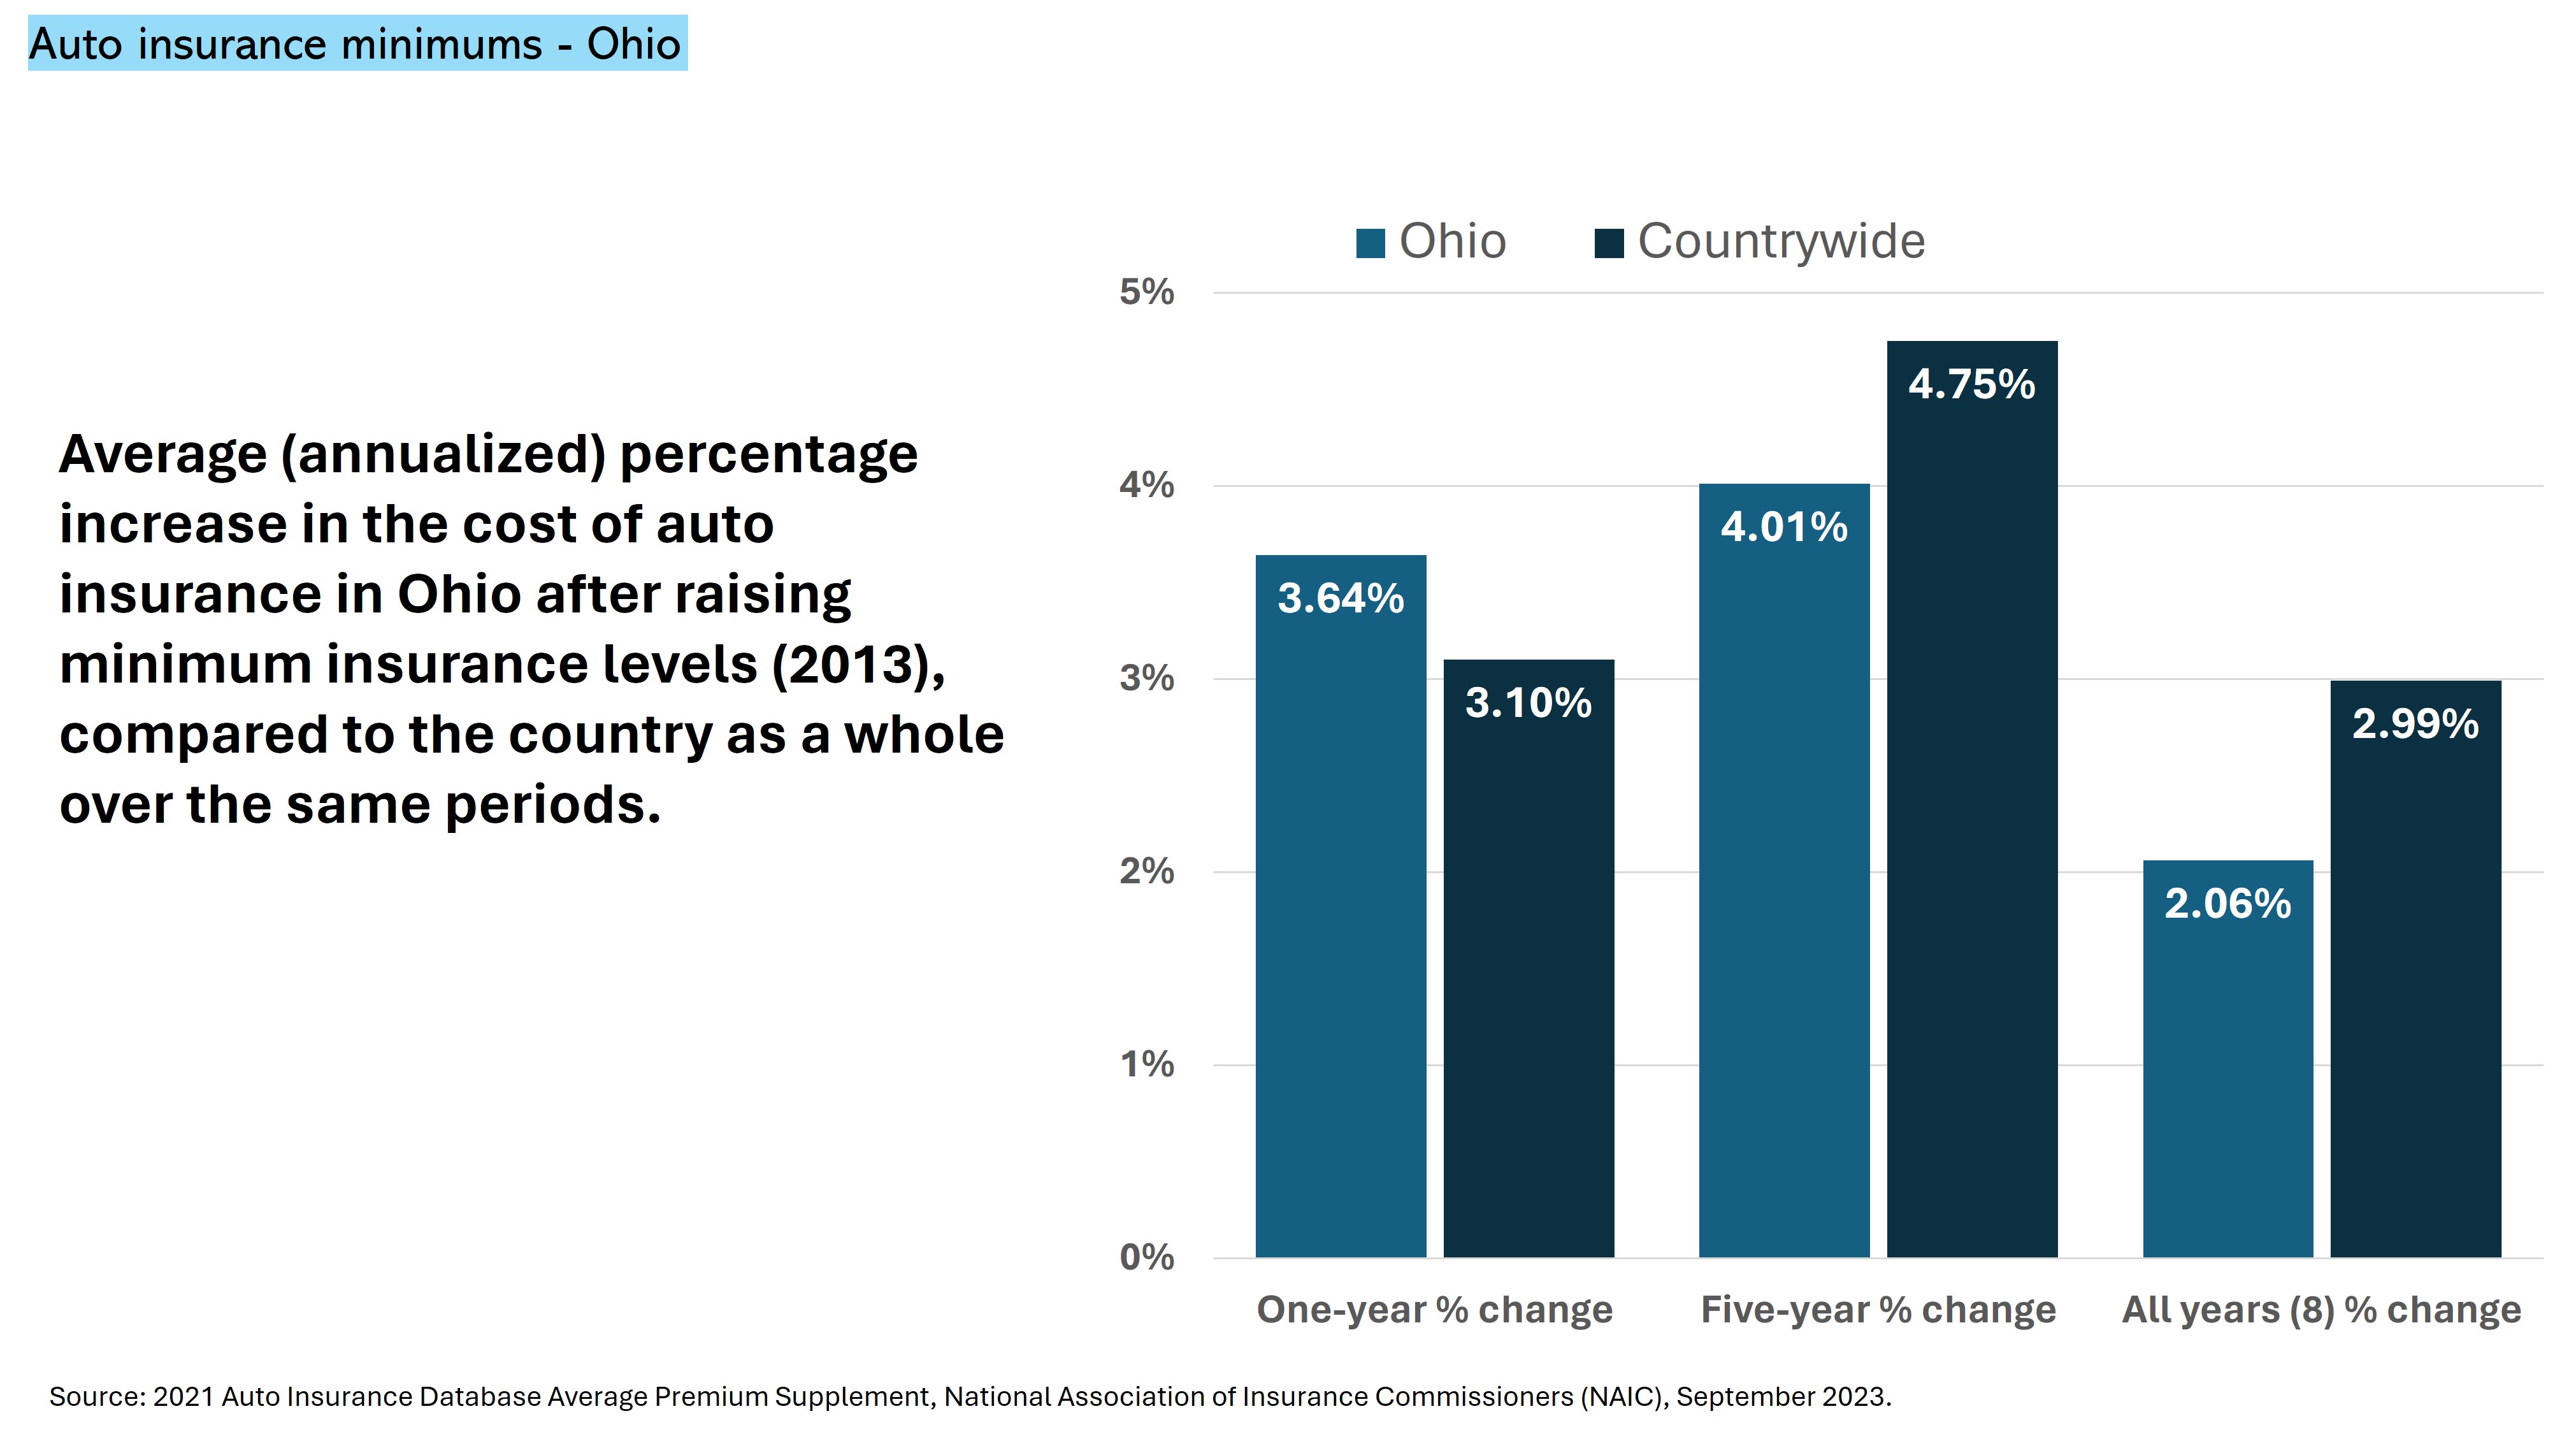
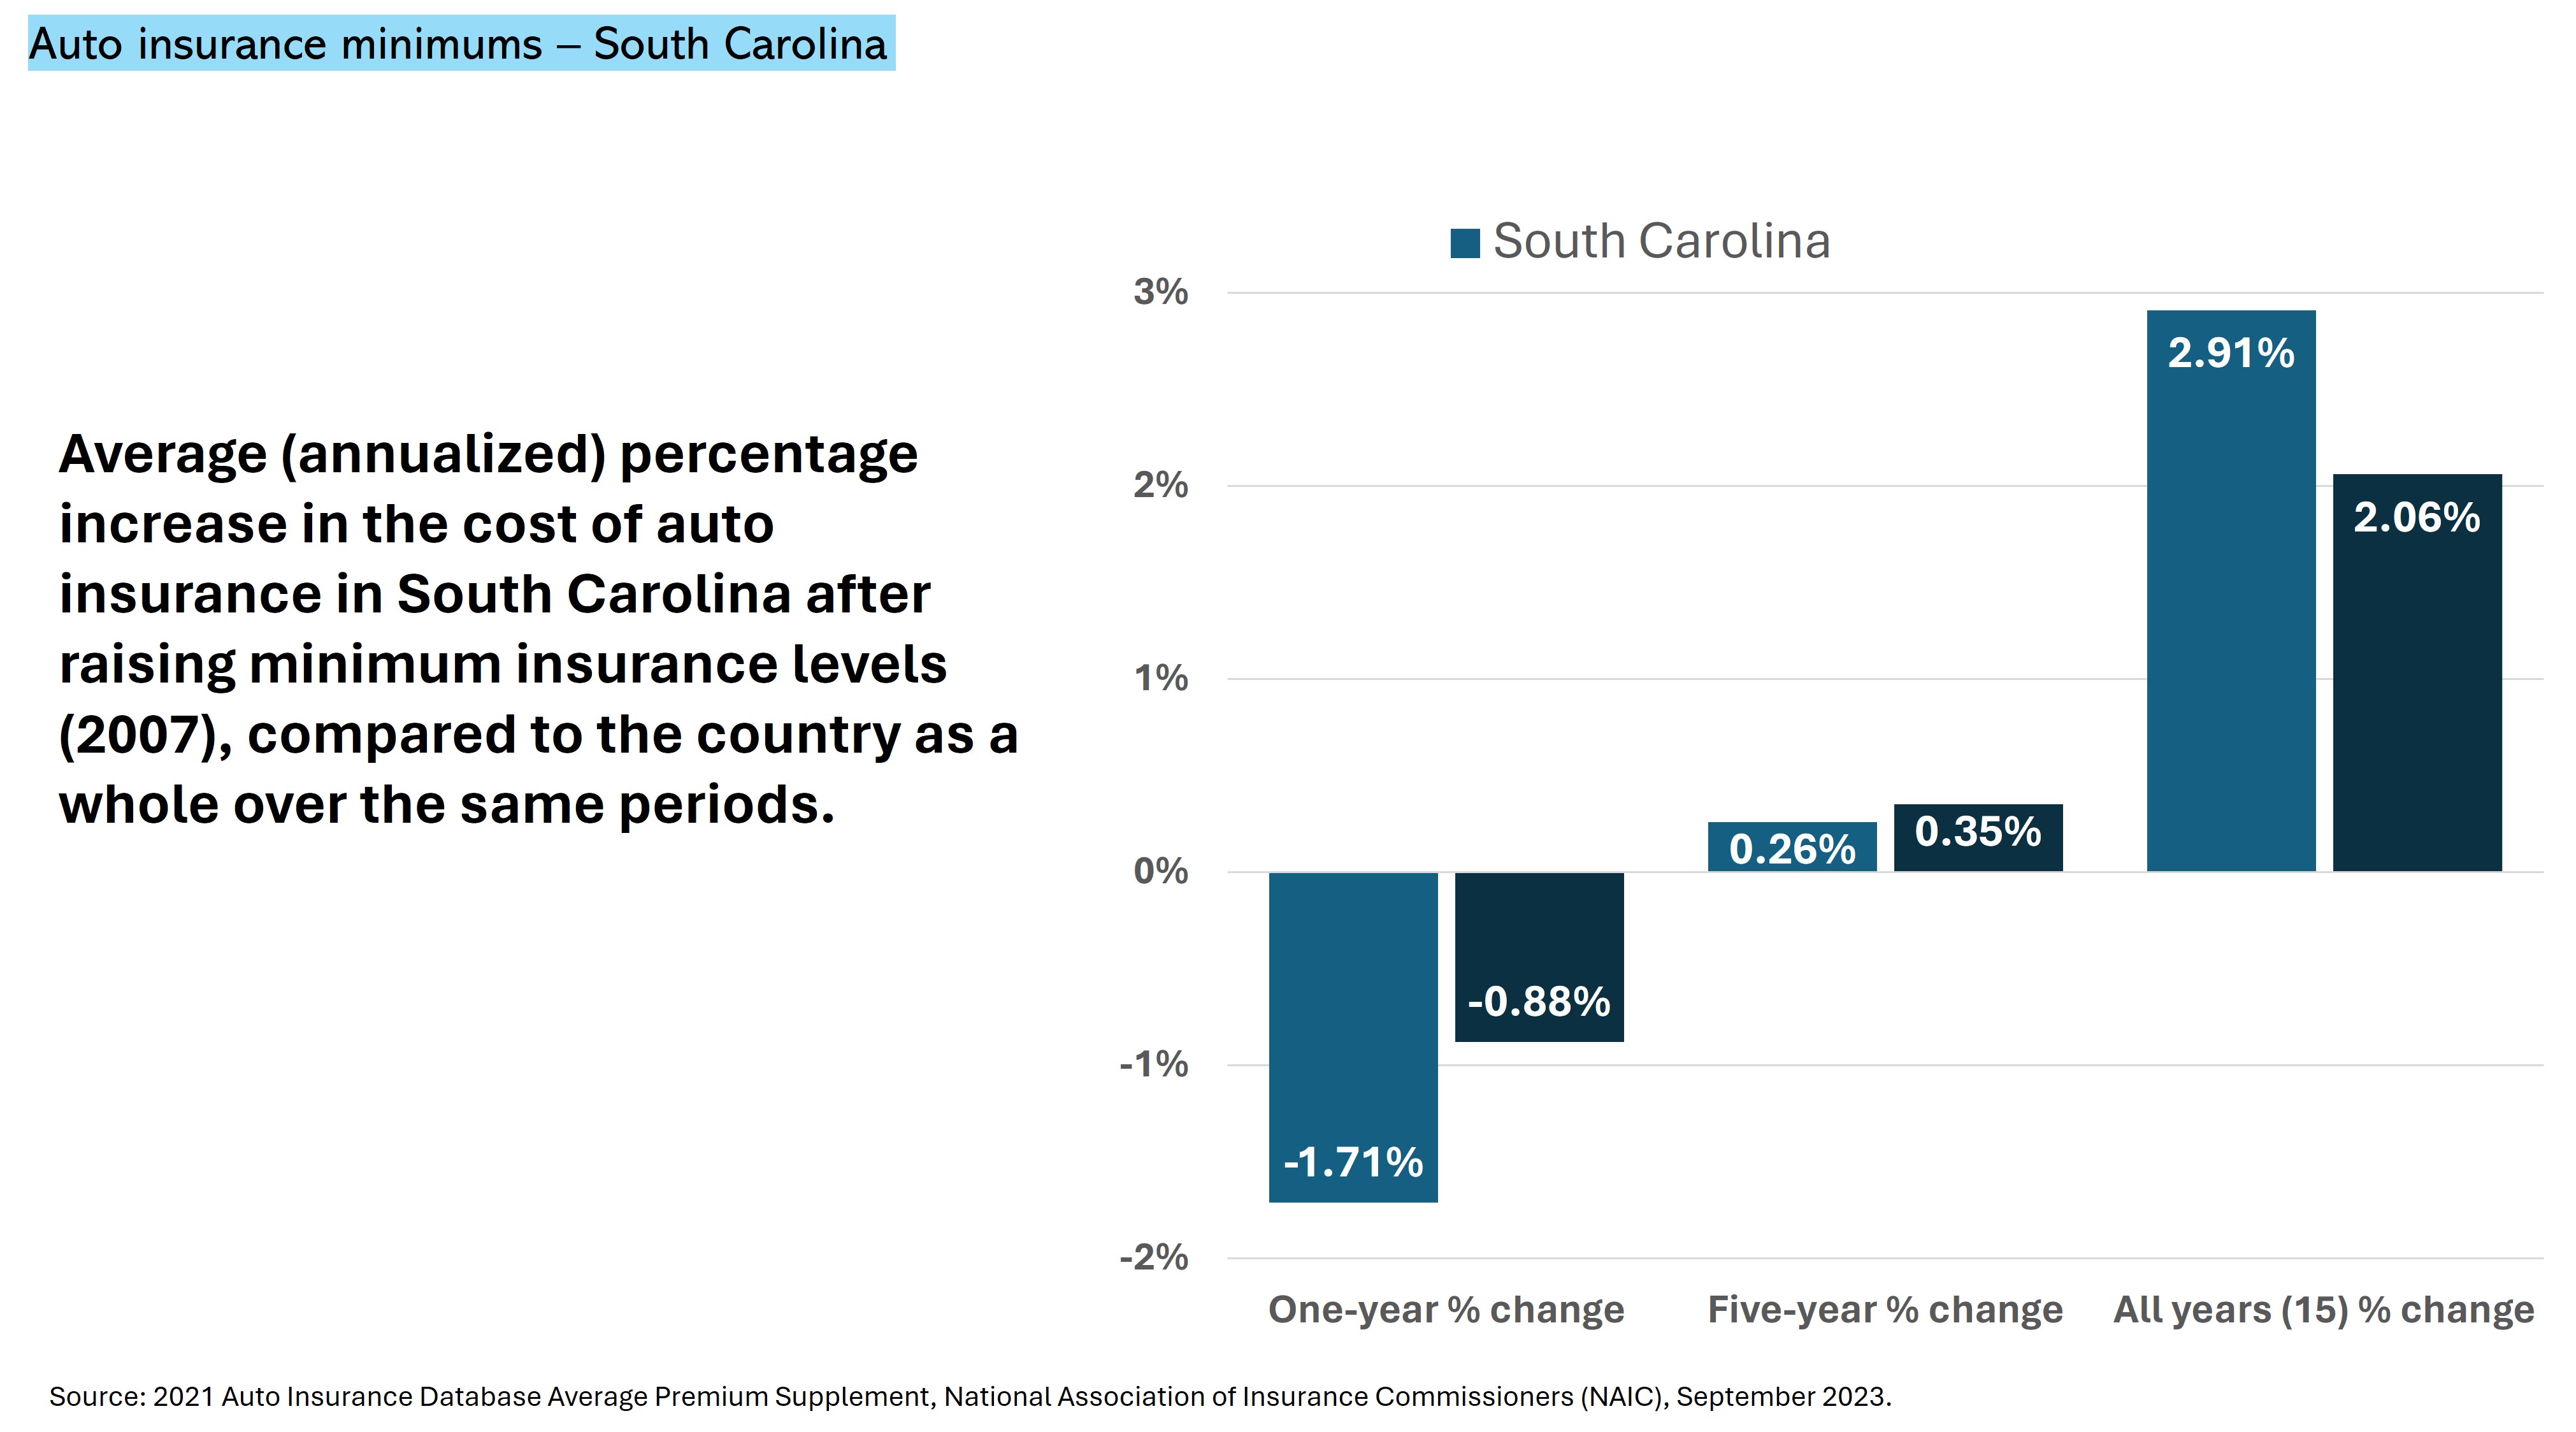
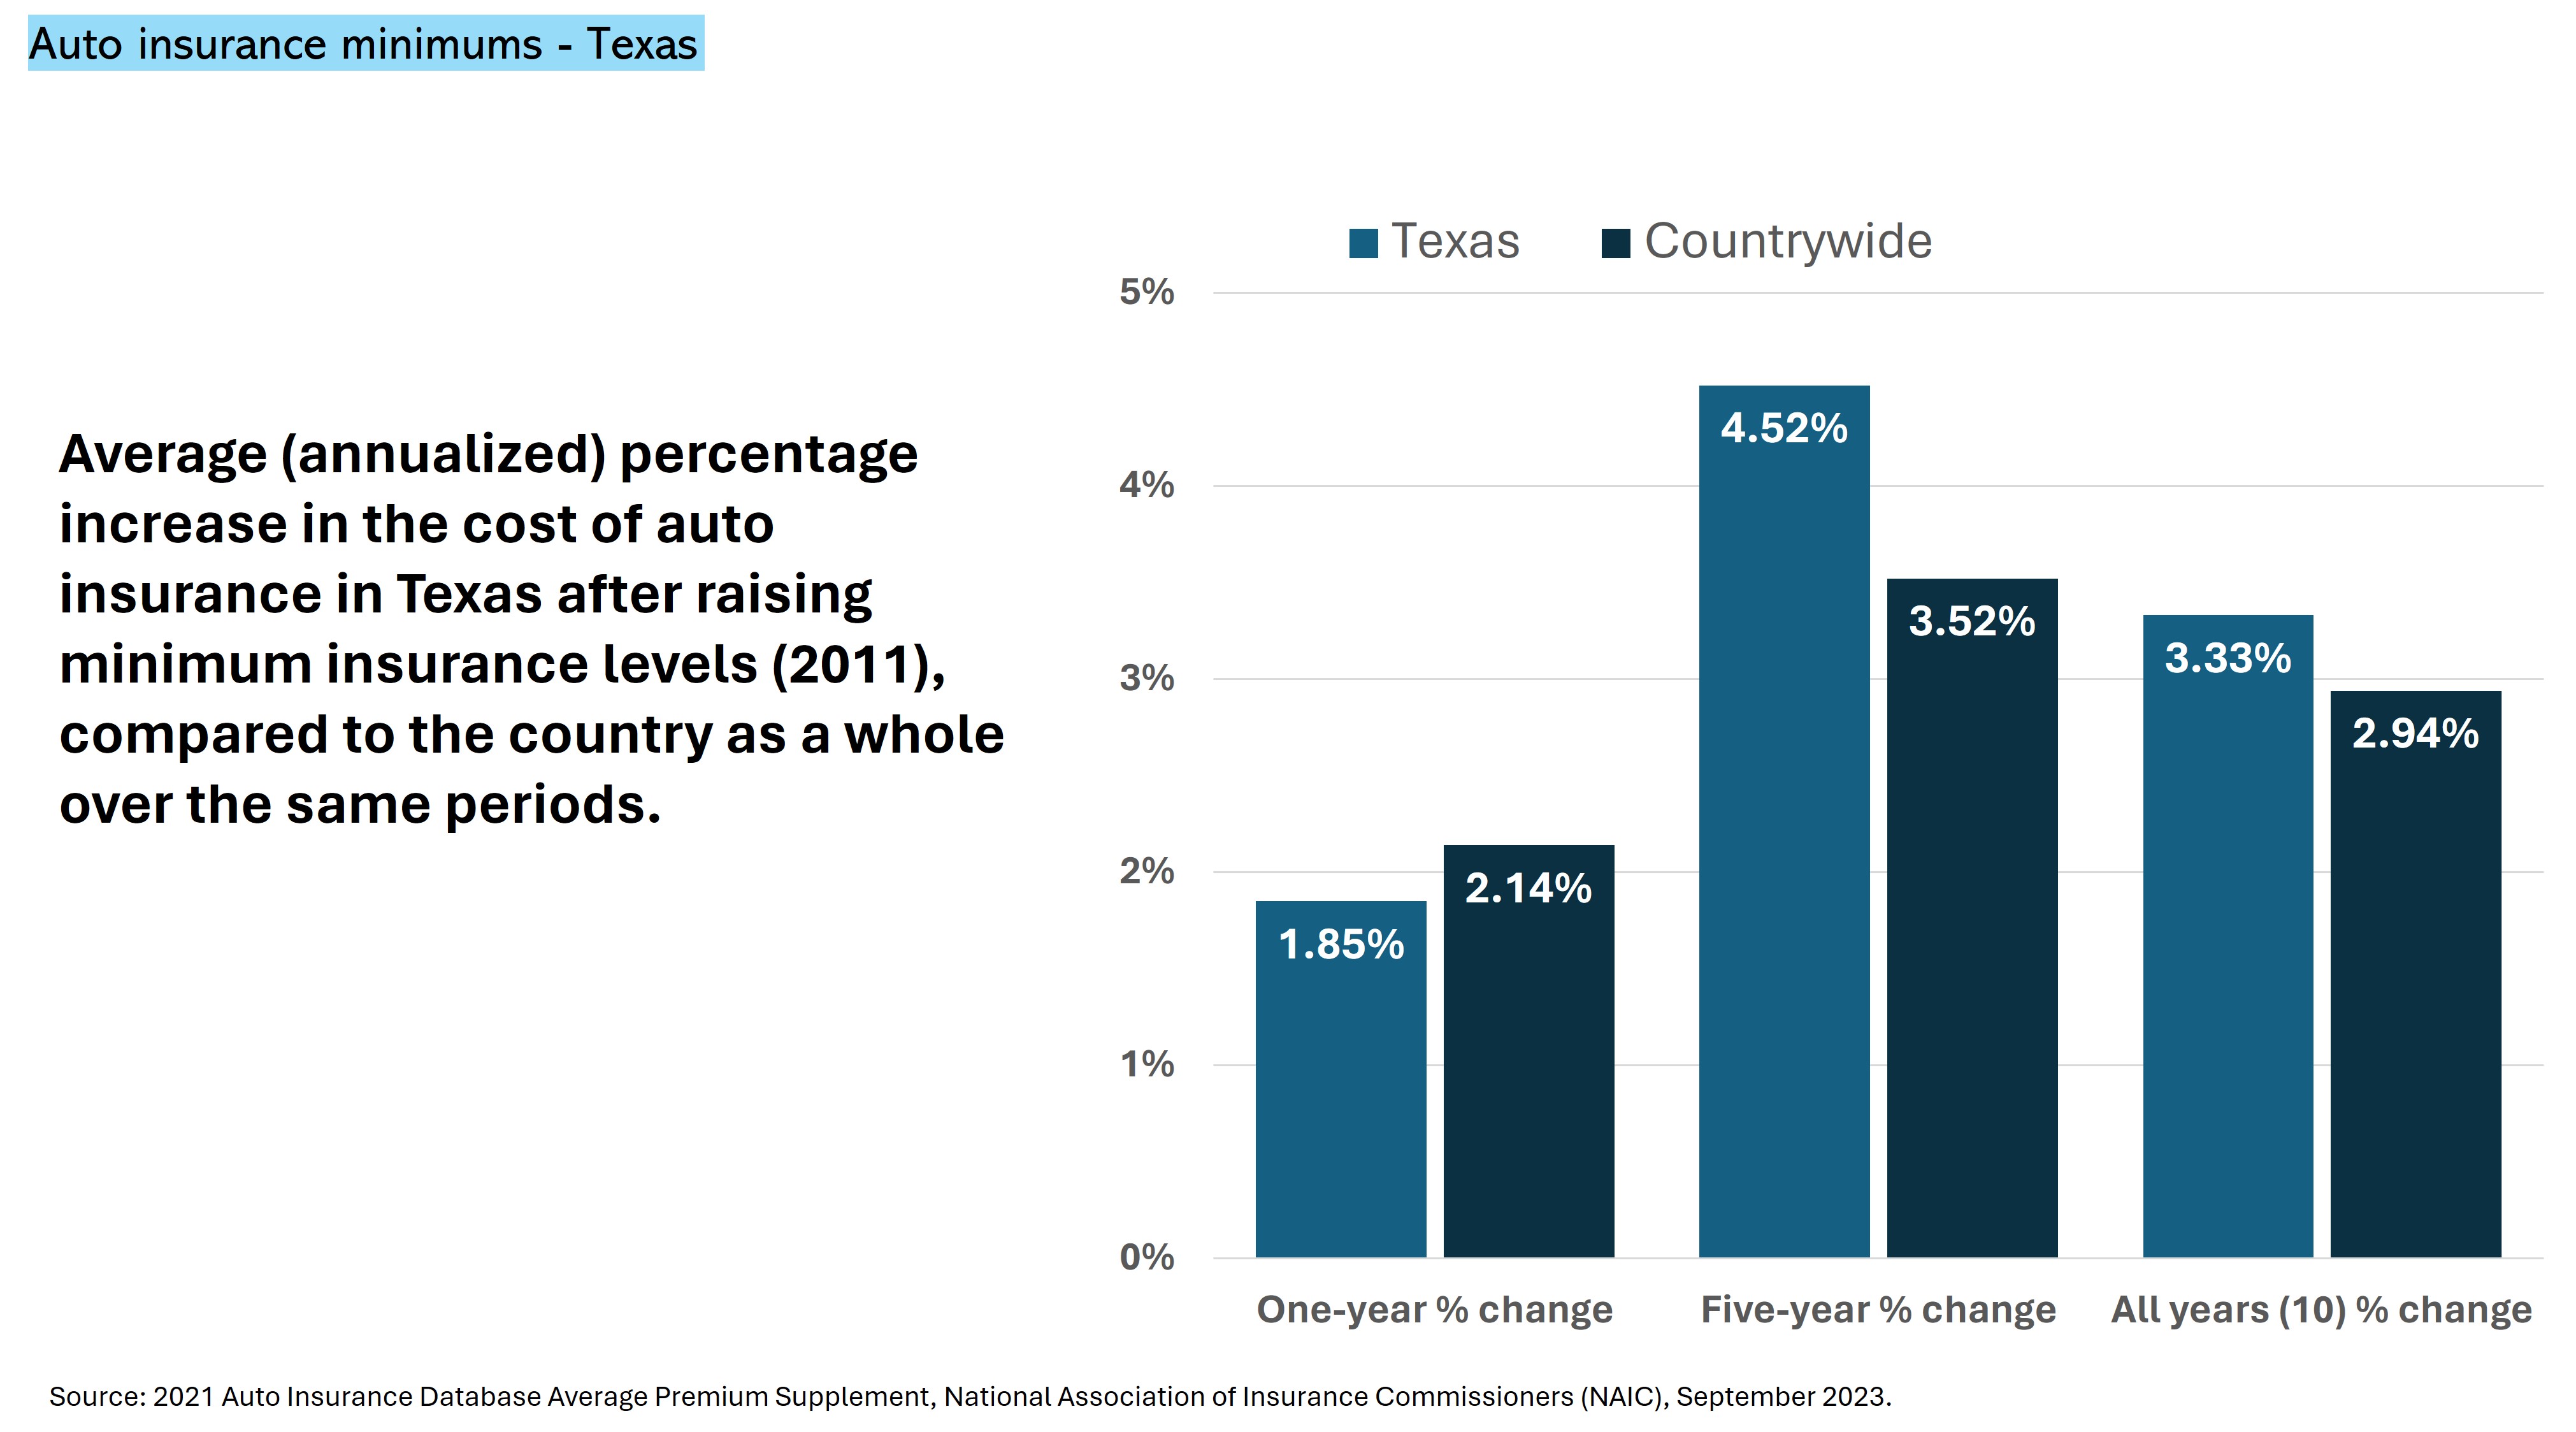
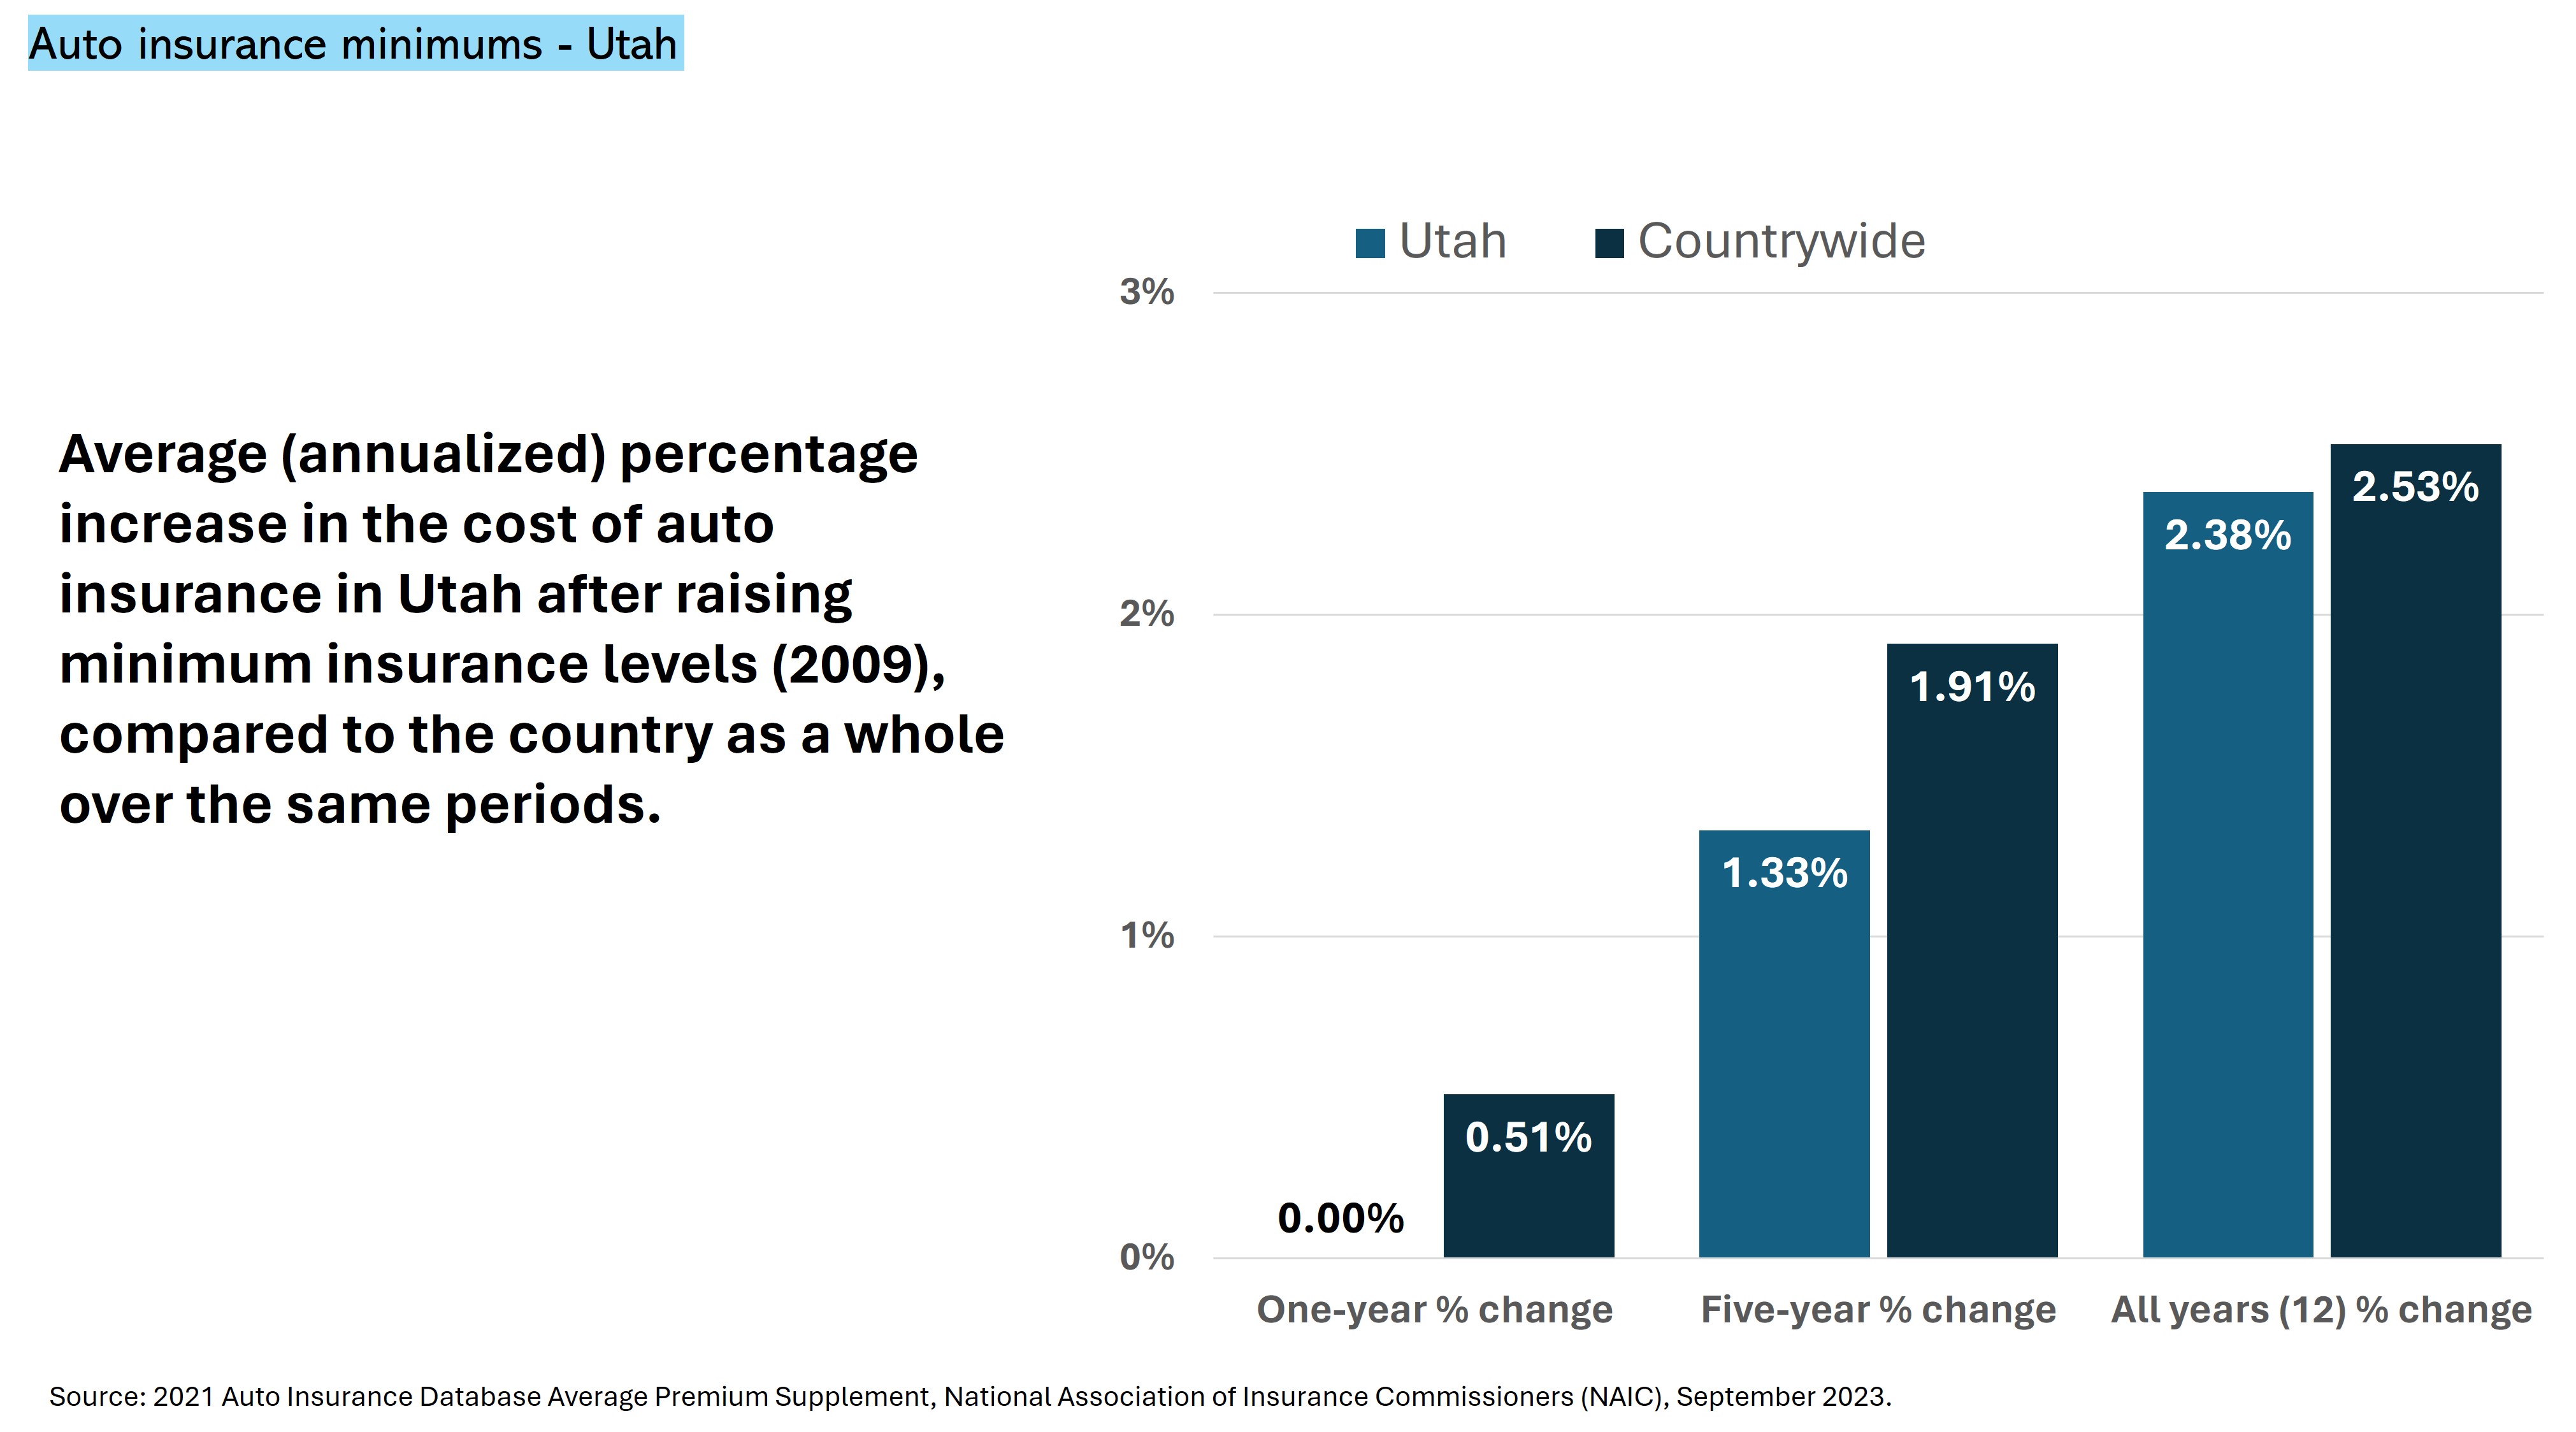
An analysis of industry data from the National Association of Insurance Commissioners (NAIC) shows that the average cost of auto insurance in states that raise their minimum levels of insurance increases at a lower rate than the country as a whole over the equivalent periods.
Academic work investigating insurance minimum levels has come to similar conclusions. Researchers from Widener Commonwealth University Law School found that the two primary objections to raising minimums—increased premiums and increased uninsured rates—were likely exaggerated. Actual premium increases after raising minimums were small and affected few drivers, while uninsured rates actually decreased.
“Even the largest of the increases is not dramatic, and the increases seem even less significant when viewed in context. It is not clear what portion, if any, of the increases are caused by raising the compulsory minimum amounts. For example, the largest annual increase, in Illinois, was $33.03 after raising the minimum amounts, a 4.1% increase. The same year, however, the national percentage increase in annual insurance costs was 5.3%, over one percent higher than Illinois’ increase. Ohio is a similar case; the year after the compulsory minimum amounts were raised, automobile insurance premiums increased $23.34, a 3.5% increase. The same year, the national percentage increase in annual insurance costs was 3.2%, just a little below Ohio’s percentage increase. Maryland (1.1%; national average 2.2%), Texas (decrease of 2.2%; national average increase of 2.2%), and Louisiana (.1%; national average .7%) all experienced a smaller percentage increase in cost than the national average the year after compulsory minimum amounts were increased.” 4
Raising Minimum Levels of Insurance Does Not Increase the Number of Uninsured Drivers
Researchers from Widener Commonwealth University Law School found that uninsured rates actually decreased in six of the last seven states to raise their minimum insurance amounts, concluding:
“The percentage of motorists driving without insurance is not necessarily related to the compulsory minimum amounts imposed by a jurisdiction. In 2015, the latest year for which data are available, the jurisdiction with the highest uninsured motorist rate imposed the smallest required amounts of insurance and the jurisdiction with the lowest uninsured motorist rate imposed the highest required amounts of insurance. Florida imposes the least stringent limits among all of jurisdictions, 10/20/10, and yet in 2015 had the highest percentage of uninsured drivers, a staggering 26.7 percent. On the other hand, Maine requires 50/100/25, and had the lowest rate of uninsured drivers at 4.5 percent.” 5
In a 2019 study conducted for the Insurance Research Council, the actuarial firm Milliman also found that higher minimum levels of insurance were not associated with higher levels of uninsured drivers. The researchers admitted that this was a surprise because their expectation was that, “high minimum insurance coverage requirements would create higher rates [and] would impose greater financial stress on individuals and cause more individuals to be uninsured.” However, their results indicated the opposite. States with higher minimum insurance levels had lower rates of uninsured motorists (UM). Indeed, states with the highest minimums had much lower UM rates.6
Conclusion
Raising minimum levels of insurance will better protect crash victims of motor vehicle crashes from being left with hefty bills to pay out of pocket. This simple policy change would bring insurance requirements in line with the real cost of motor vehicle crashes, and thus help to alleviate financial burdens on individuals and families affected by crashes. The perceived downsides to such public policy—increased insurance rates and increased numbers of uninsured drivers—turns out to be more myth than fact.
Methodology
Data on the average auto insurance cost (expenditures) per insured vehicle for the last 15 years (2007-2021) were taken from the NAIC’s Auto Insurance Database Report and Auto Insurance Database Premium Supplement (various editions). The average cost refers to the total written premium for liability, collision, and comprehensive coverages divided by the liability written car-years (exposures). The average cost is an estimate of what consumers in the state spent, on average, for auto insurance. Increases in the cost and premium data for states that raised auto insurance minimum levels during this period were annualized (wherein the inflationary effect is converted into an annual percent change) and then compared to the countrywide data for the same respective periods.
Appendix
Average Spending on Auto Insurance, 2007-2021
See also States that have Raised Minimum Insurance Levels (2007-2021) below for details on minimum insurance levels before and after changes.

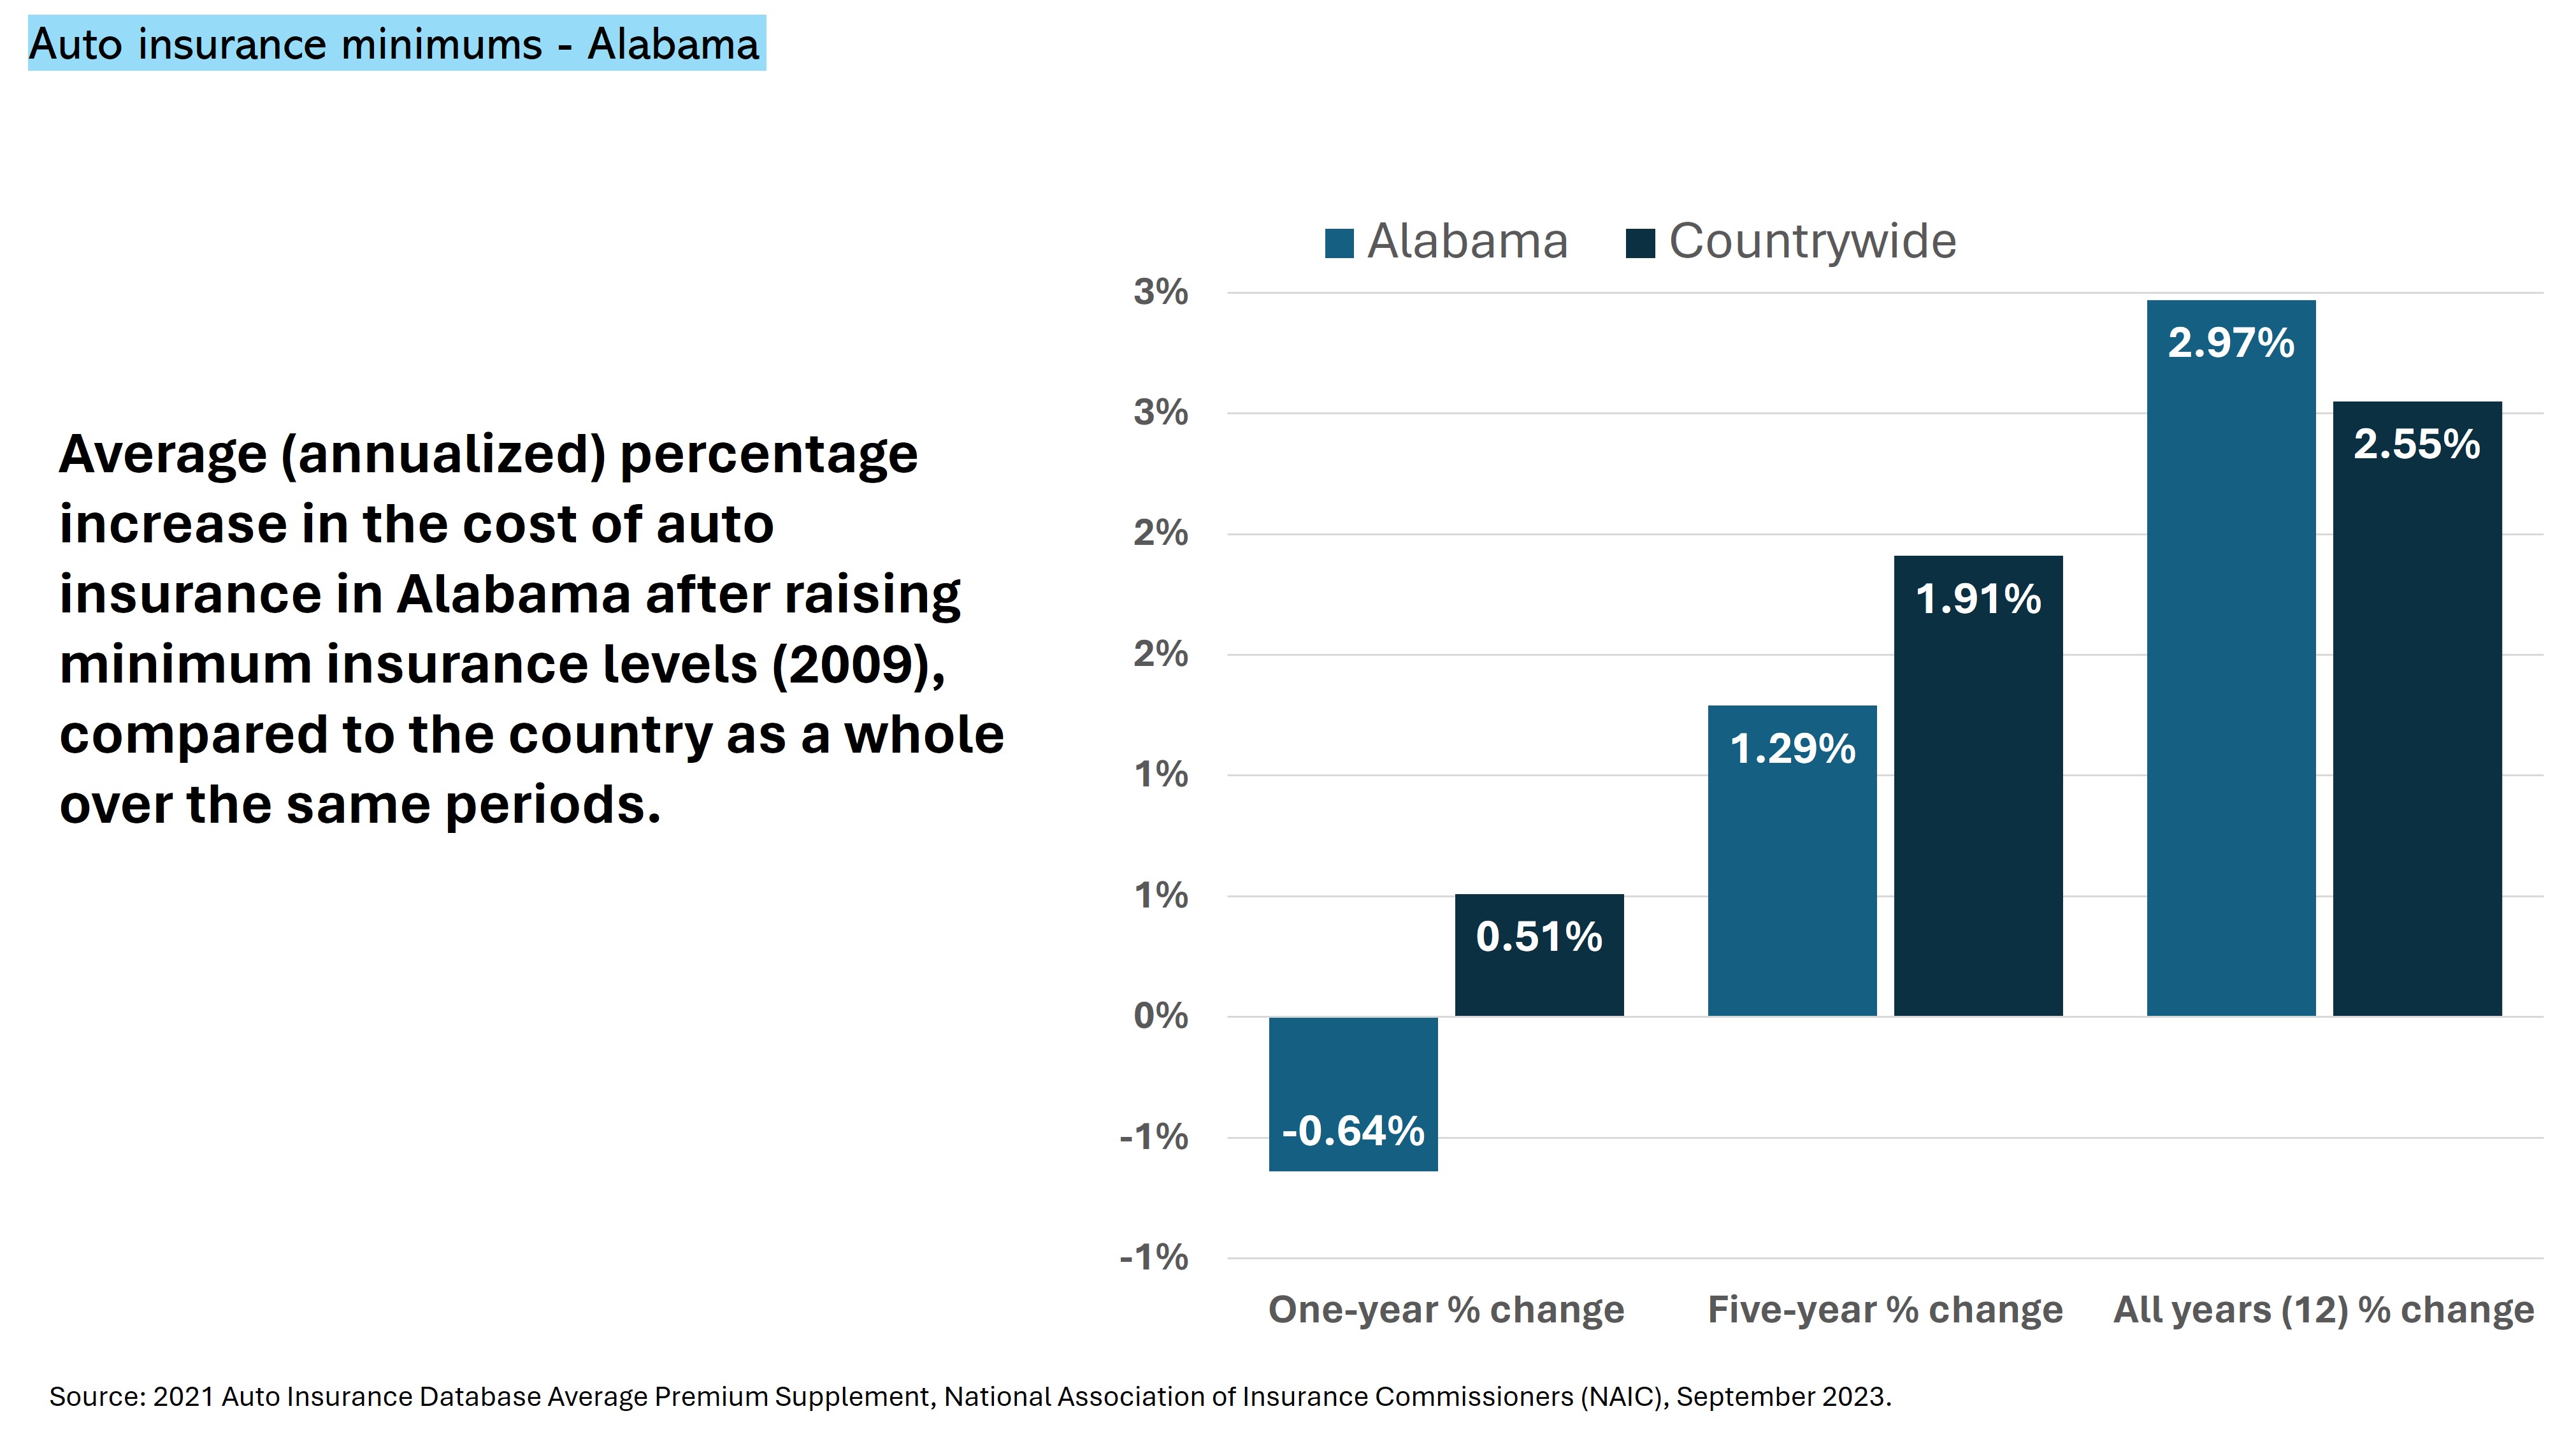
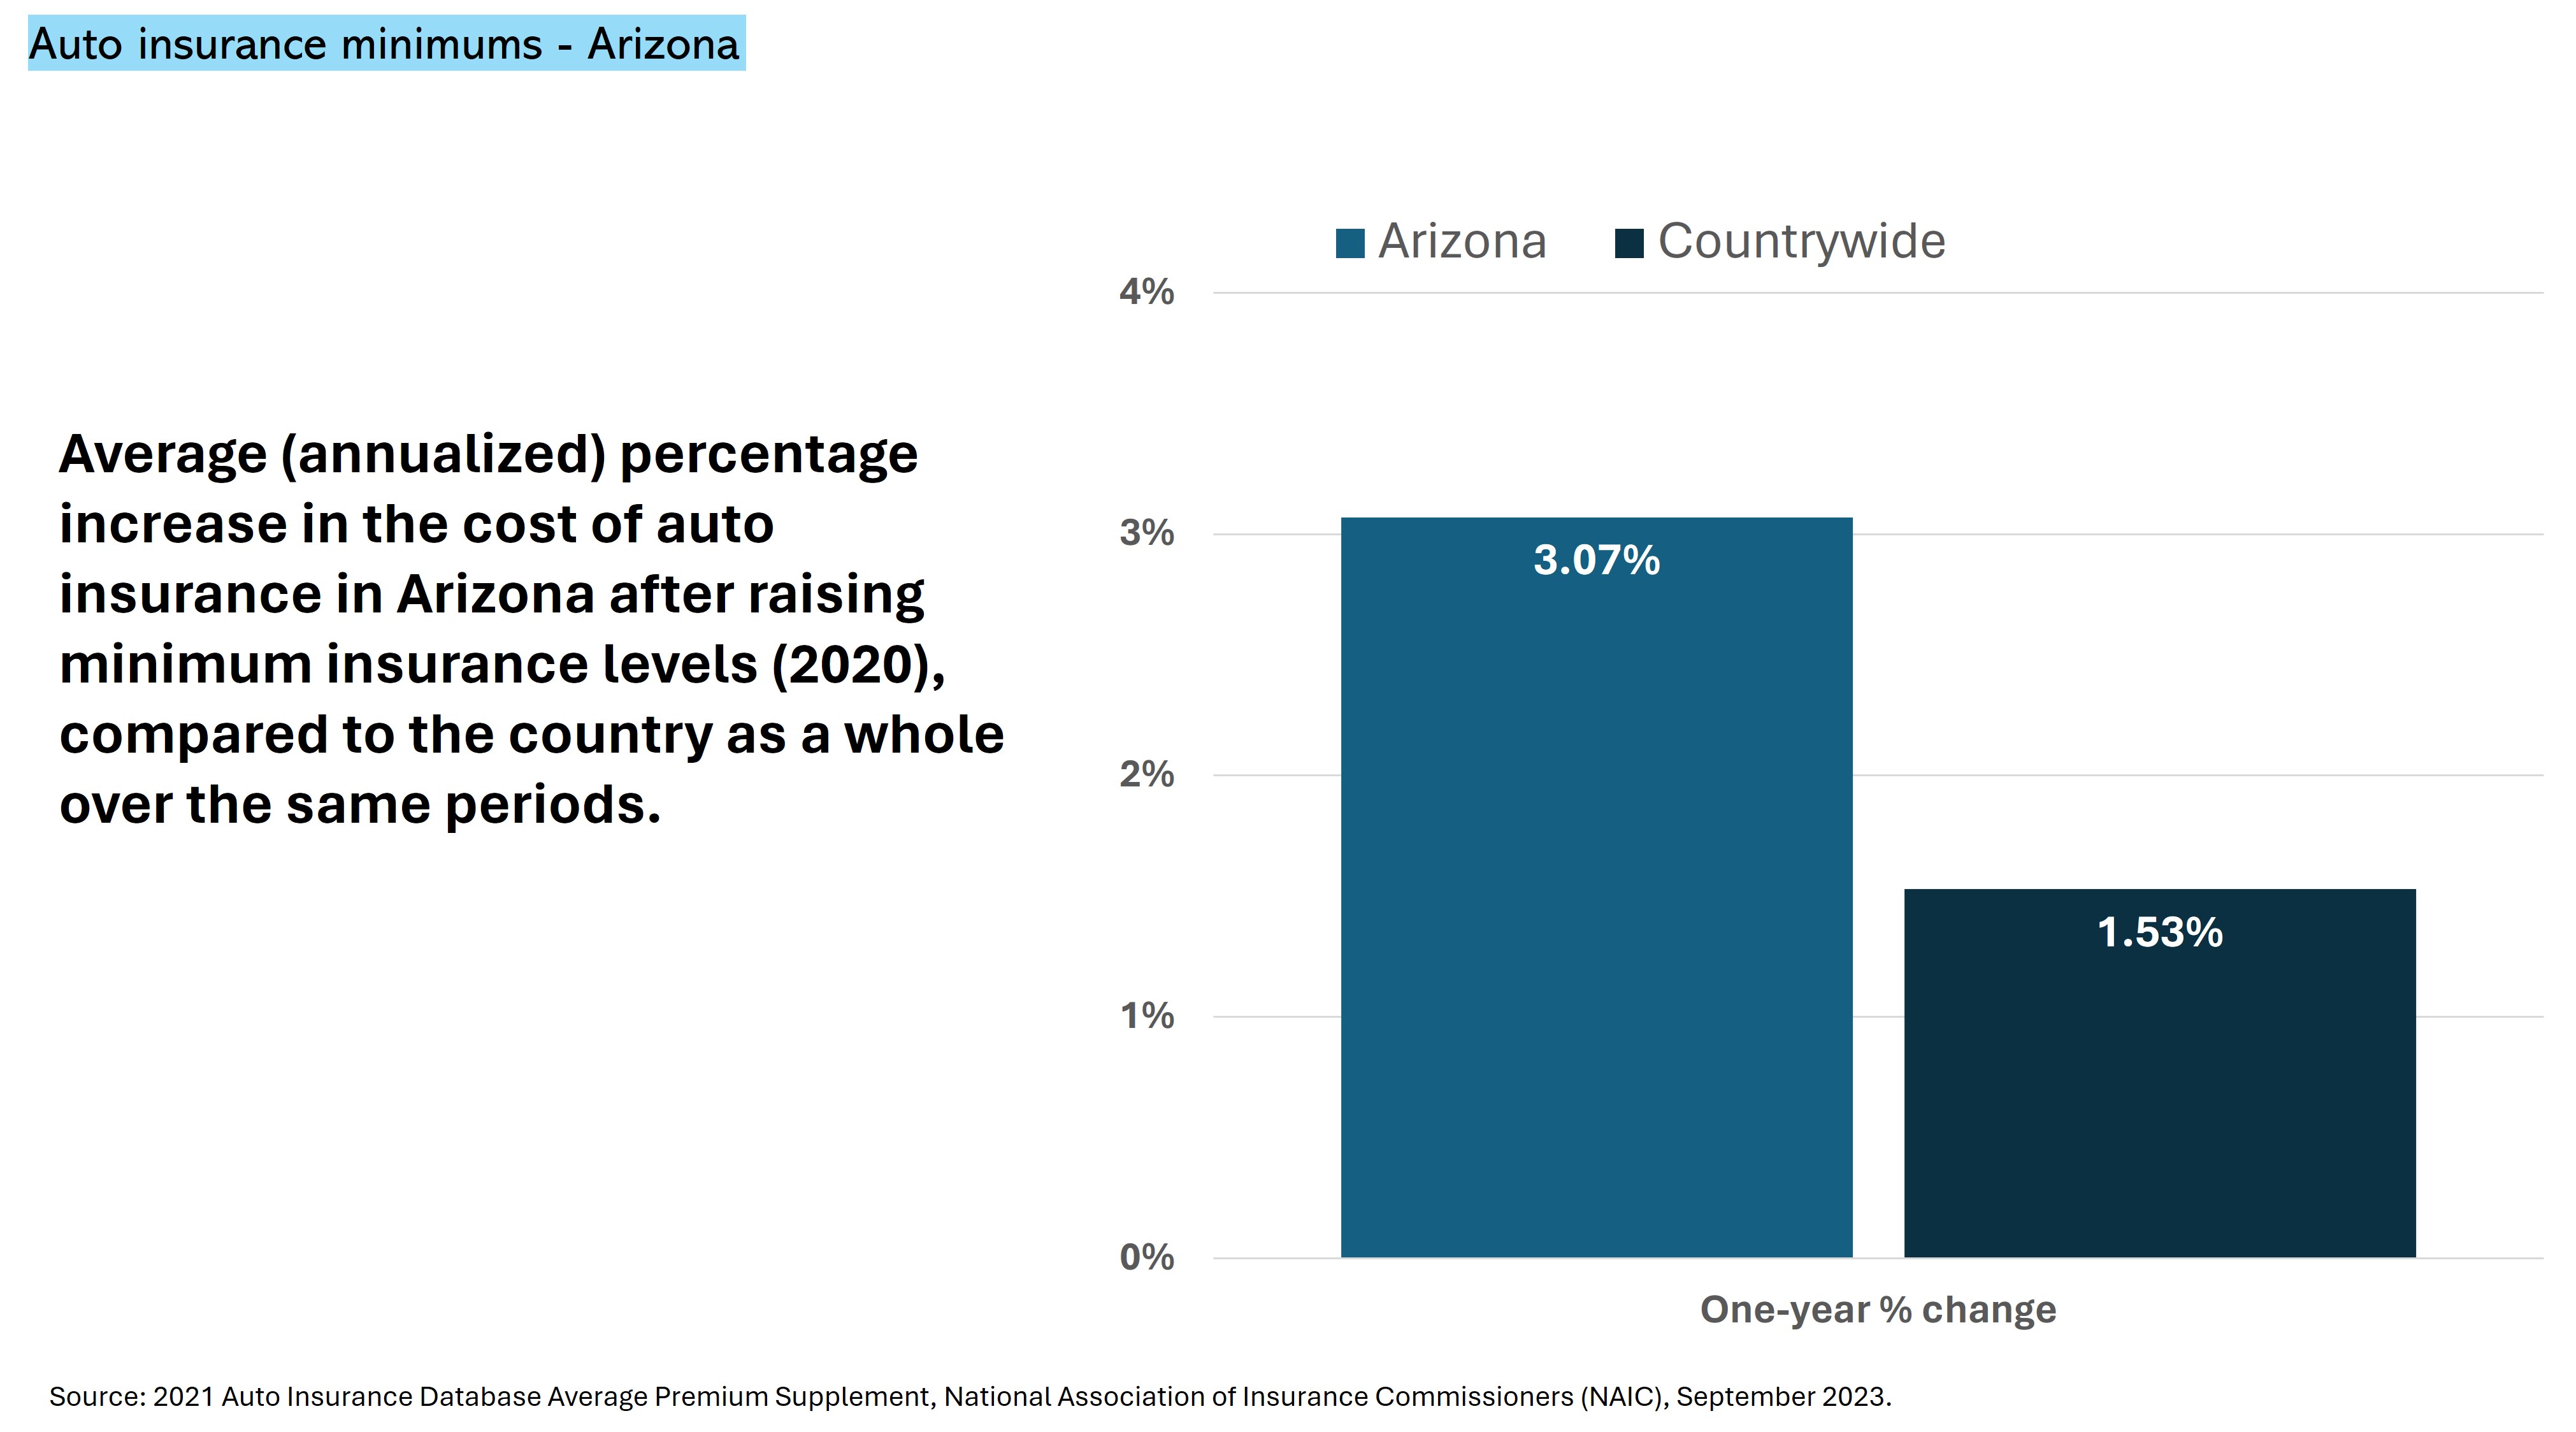
State Insurance Costs After Raising Minimums
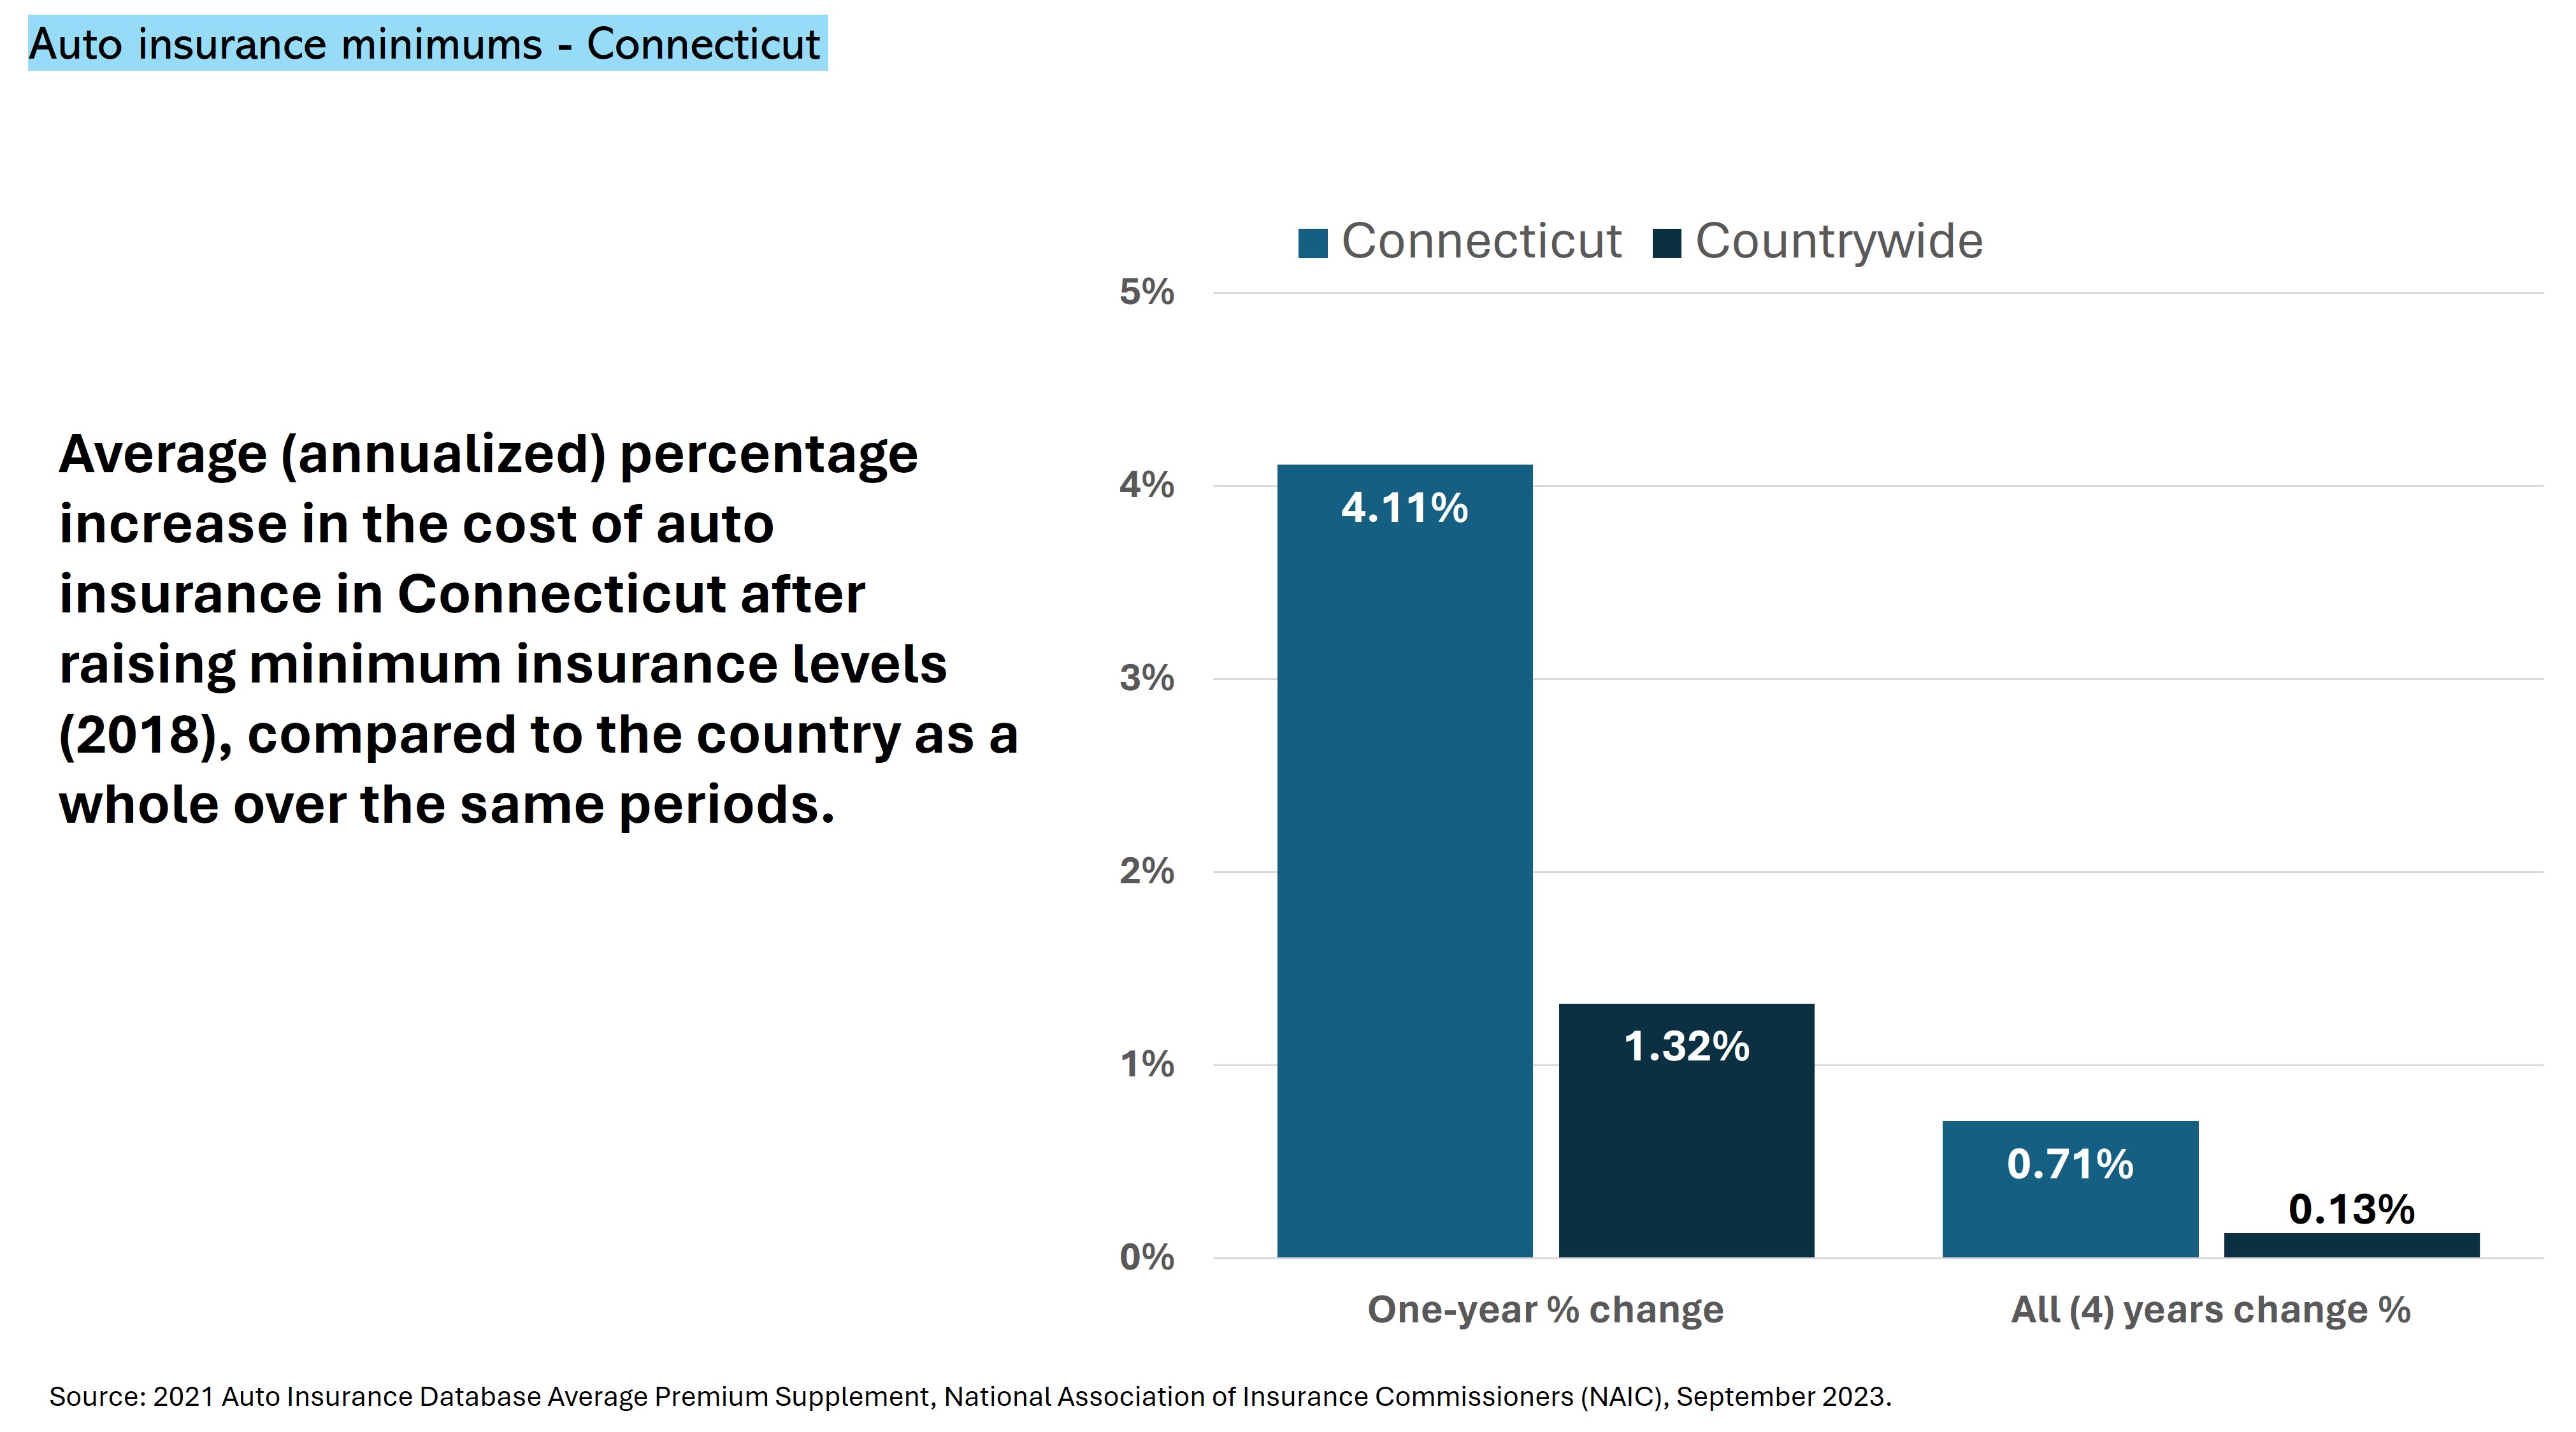
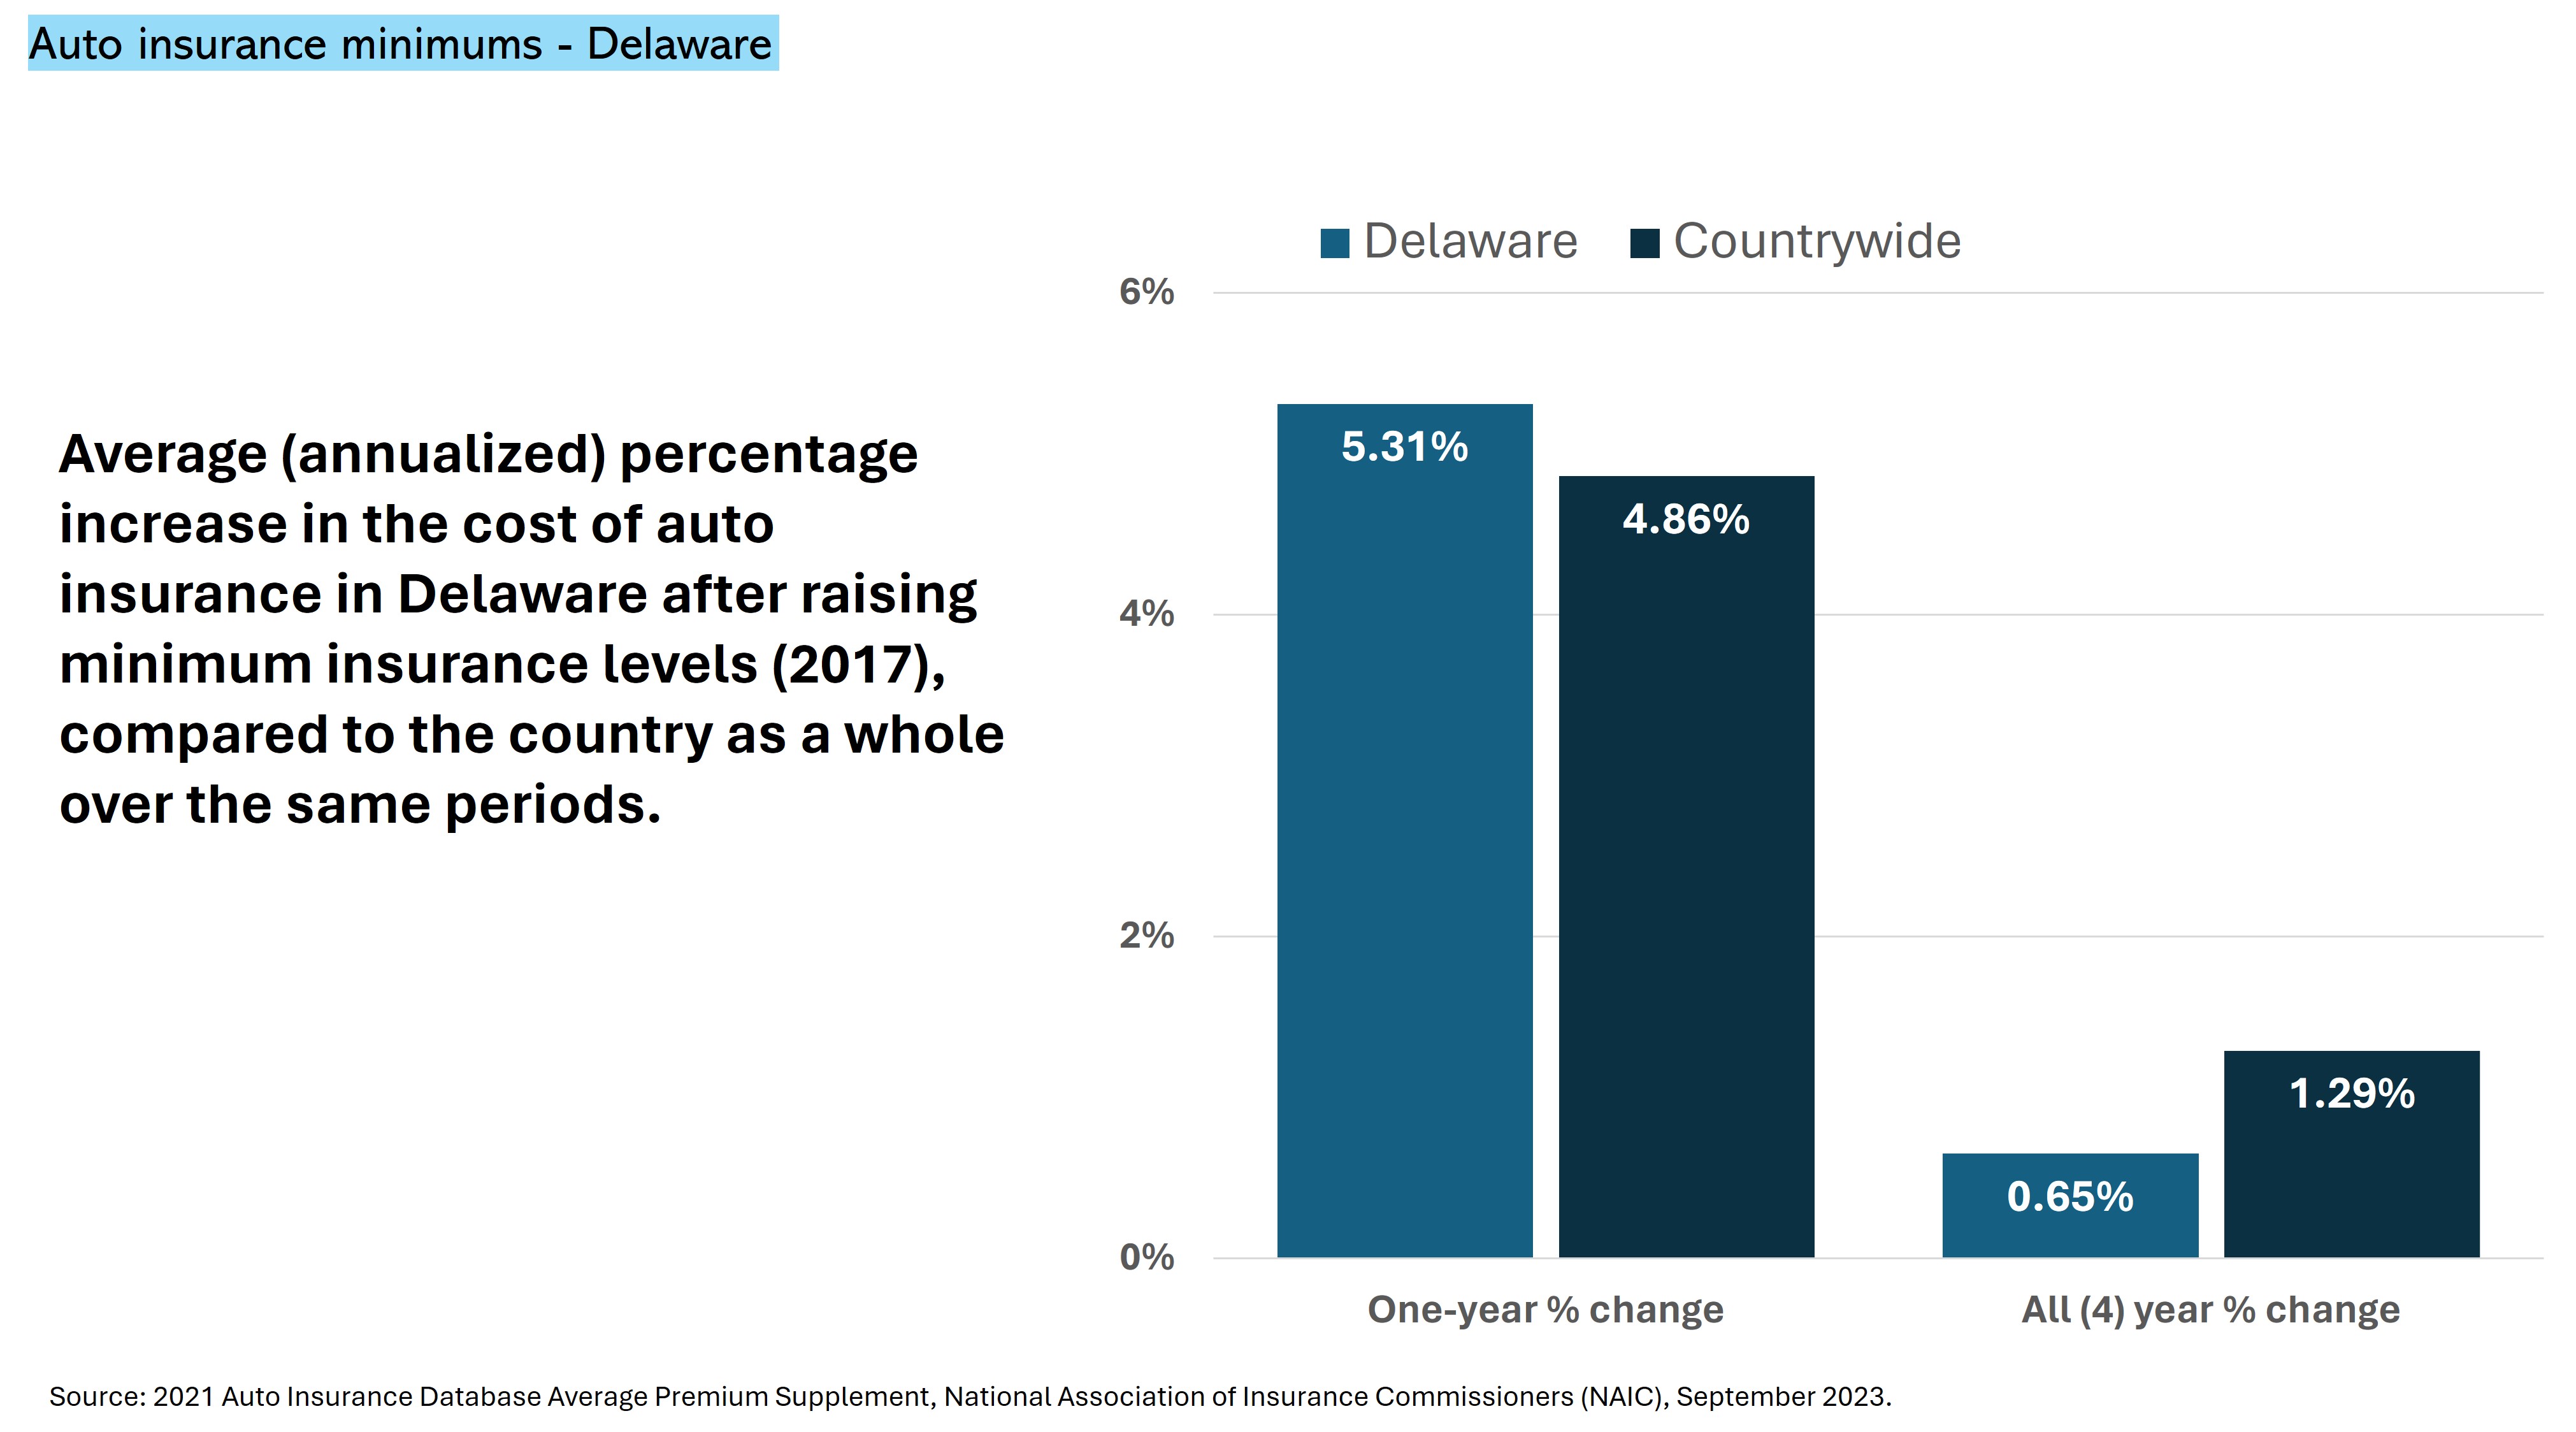
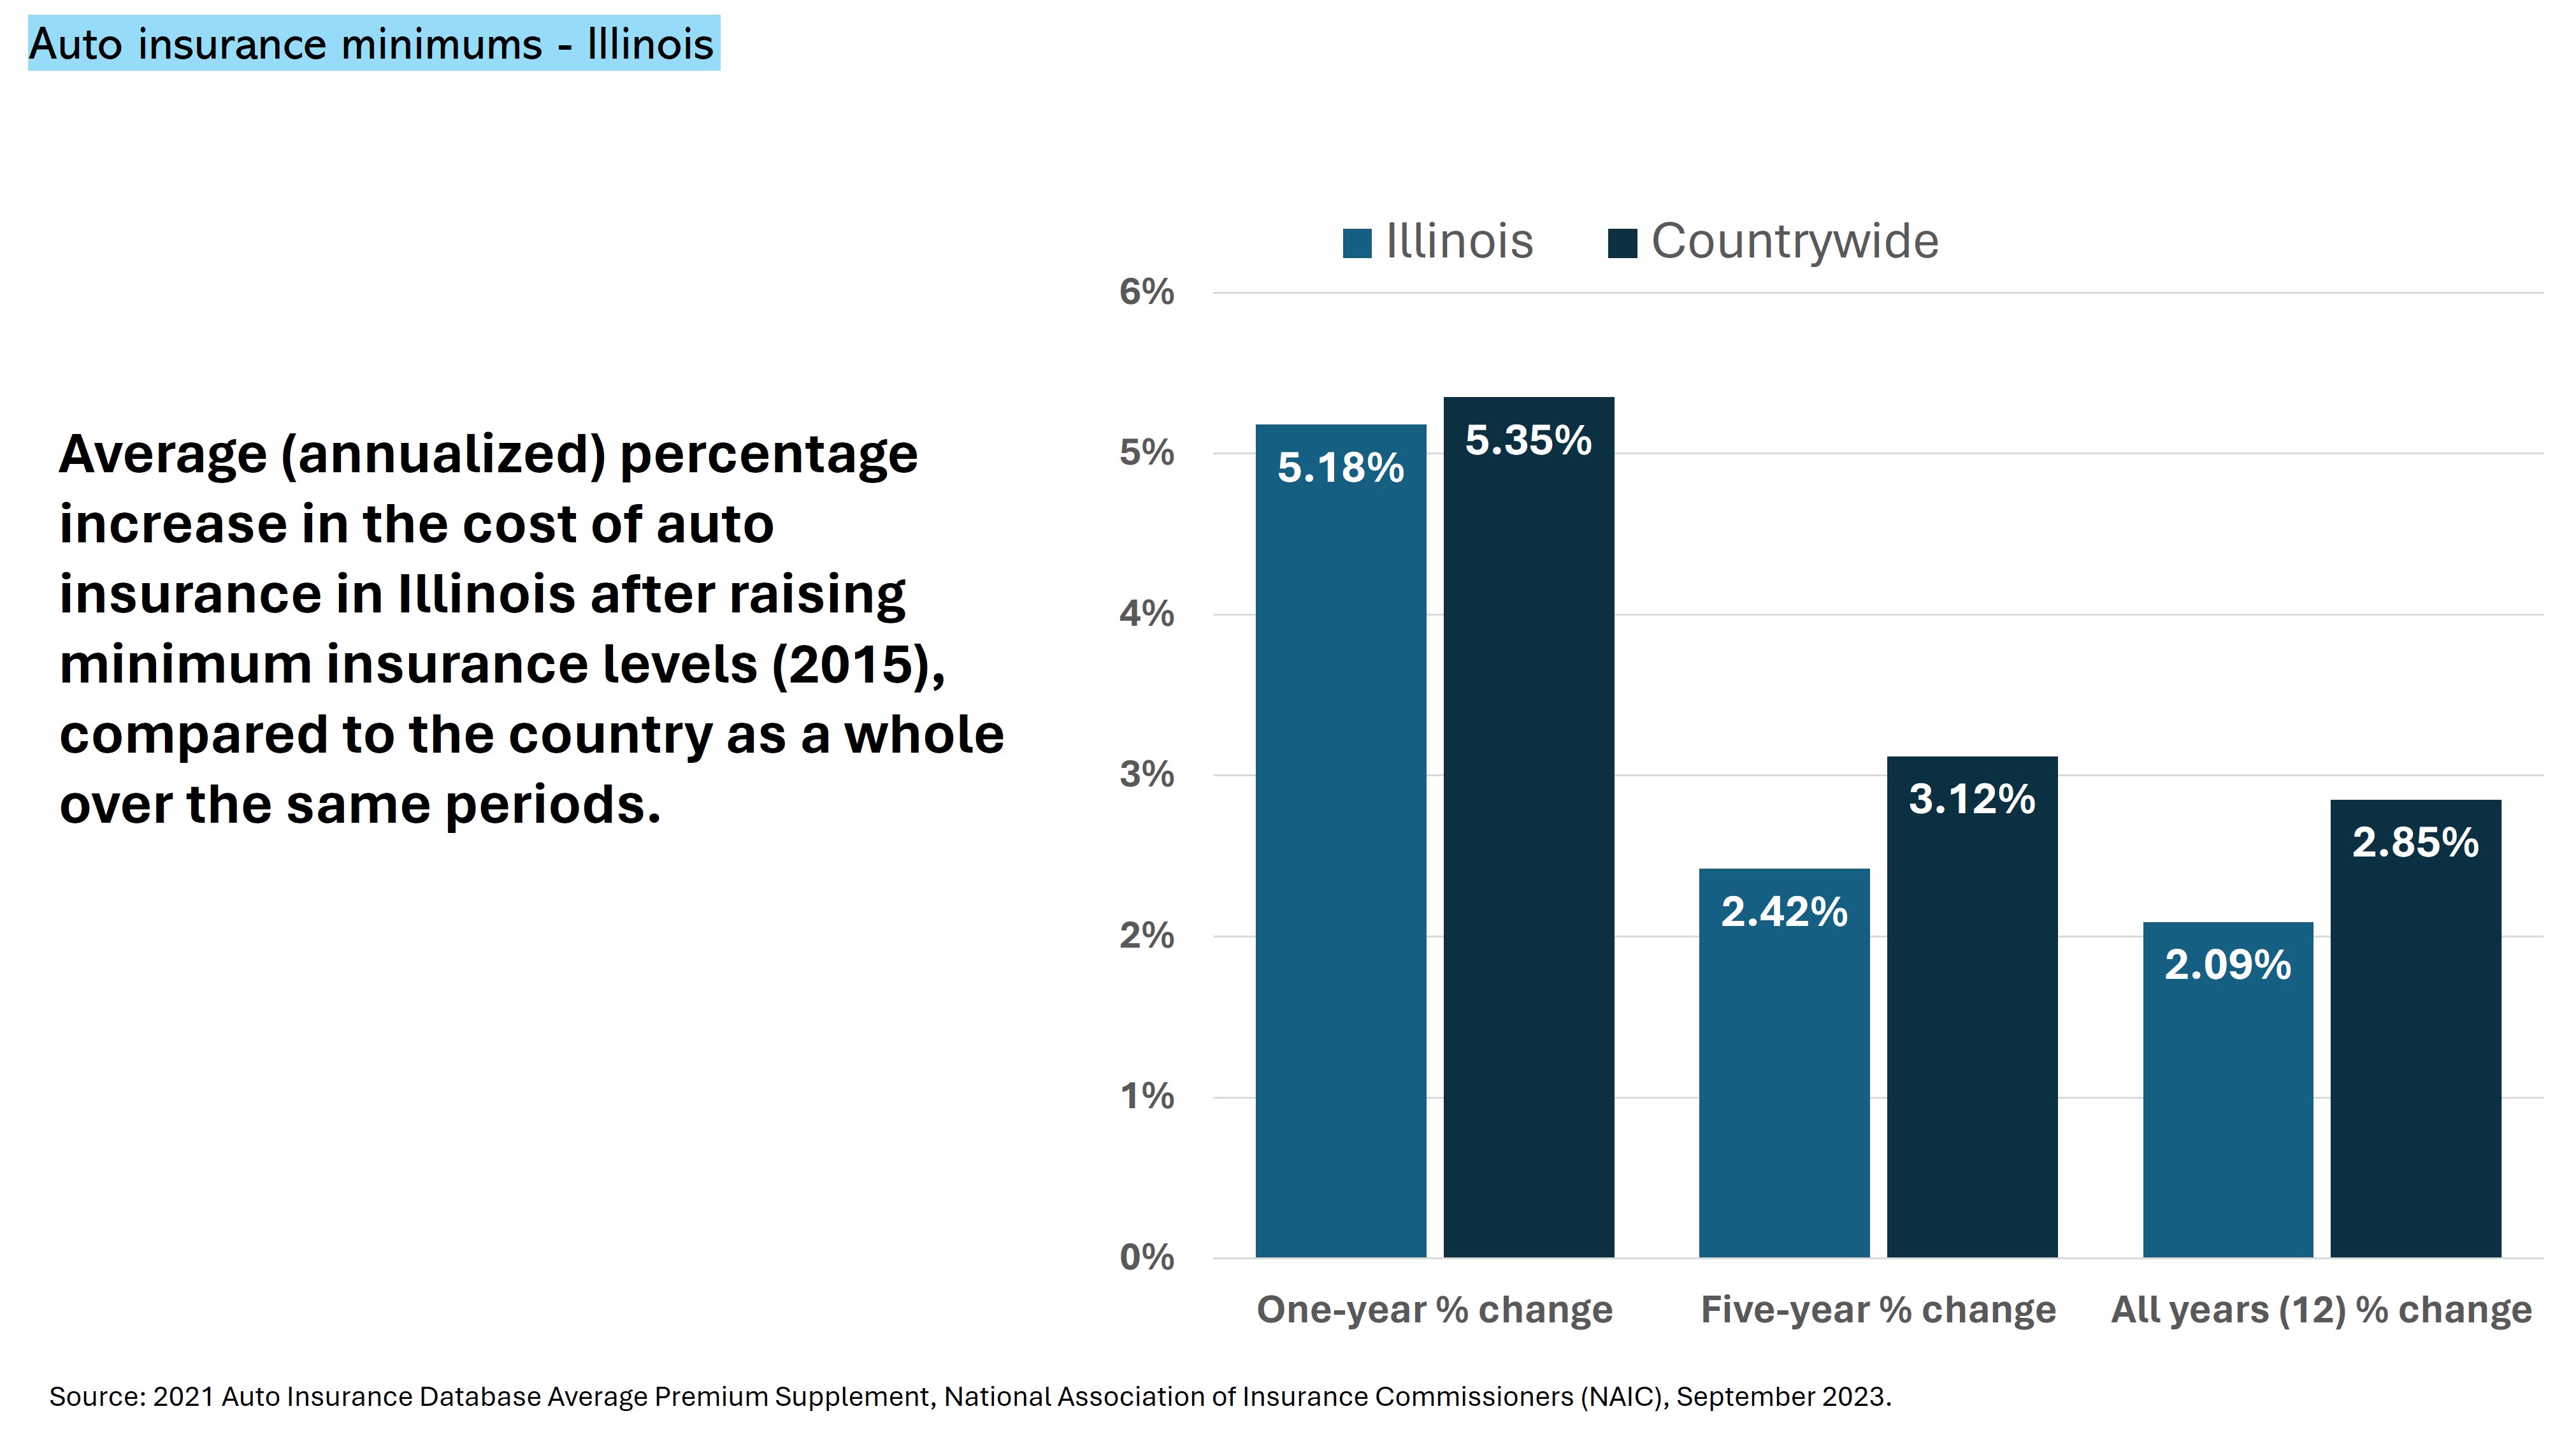
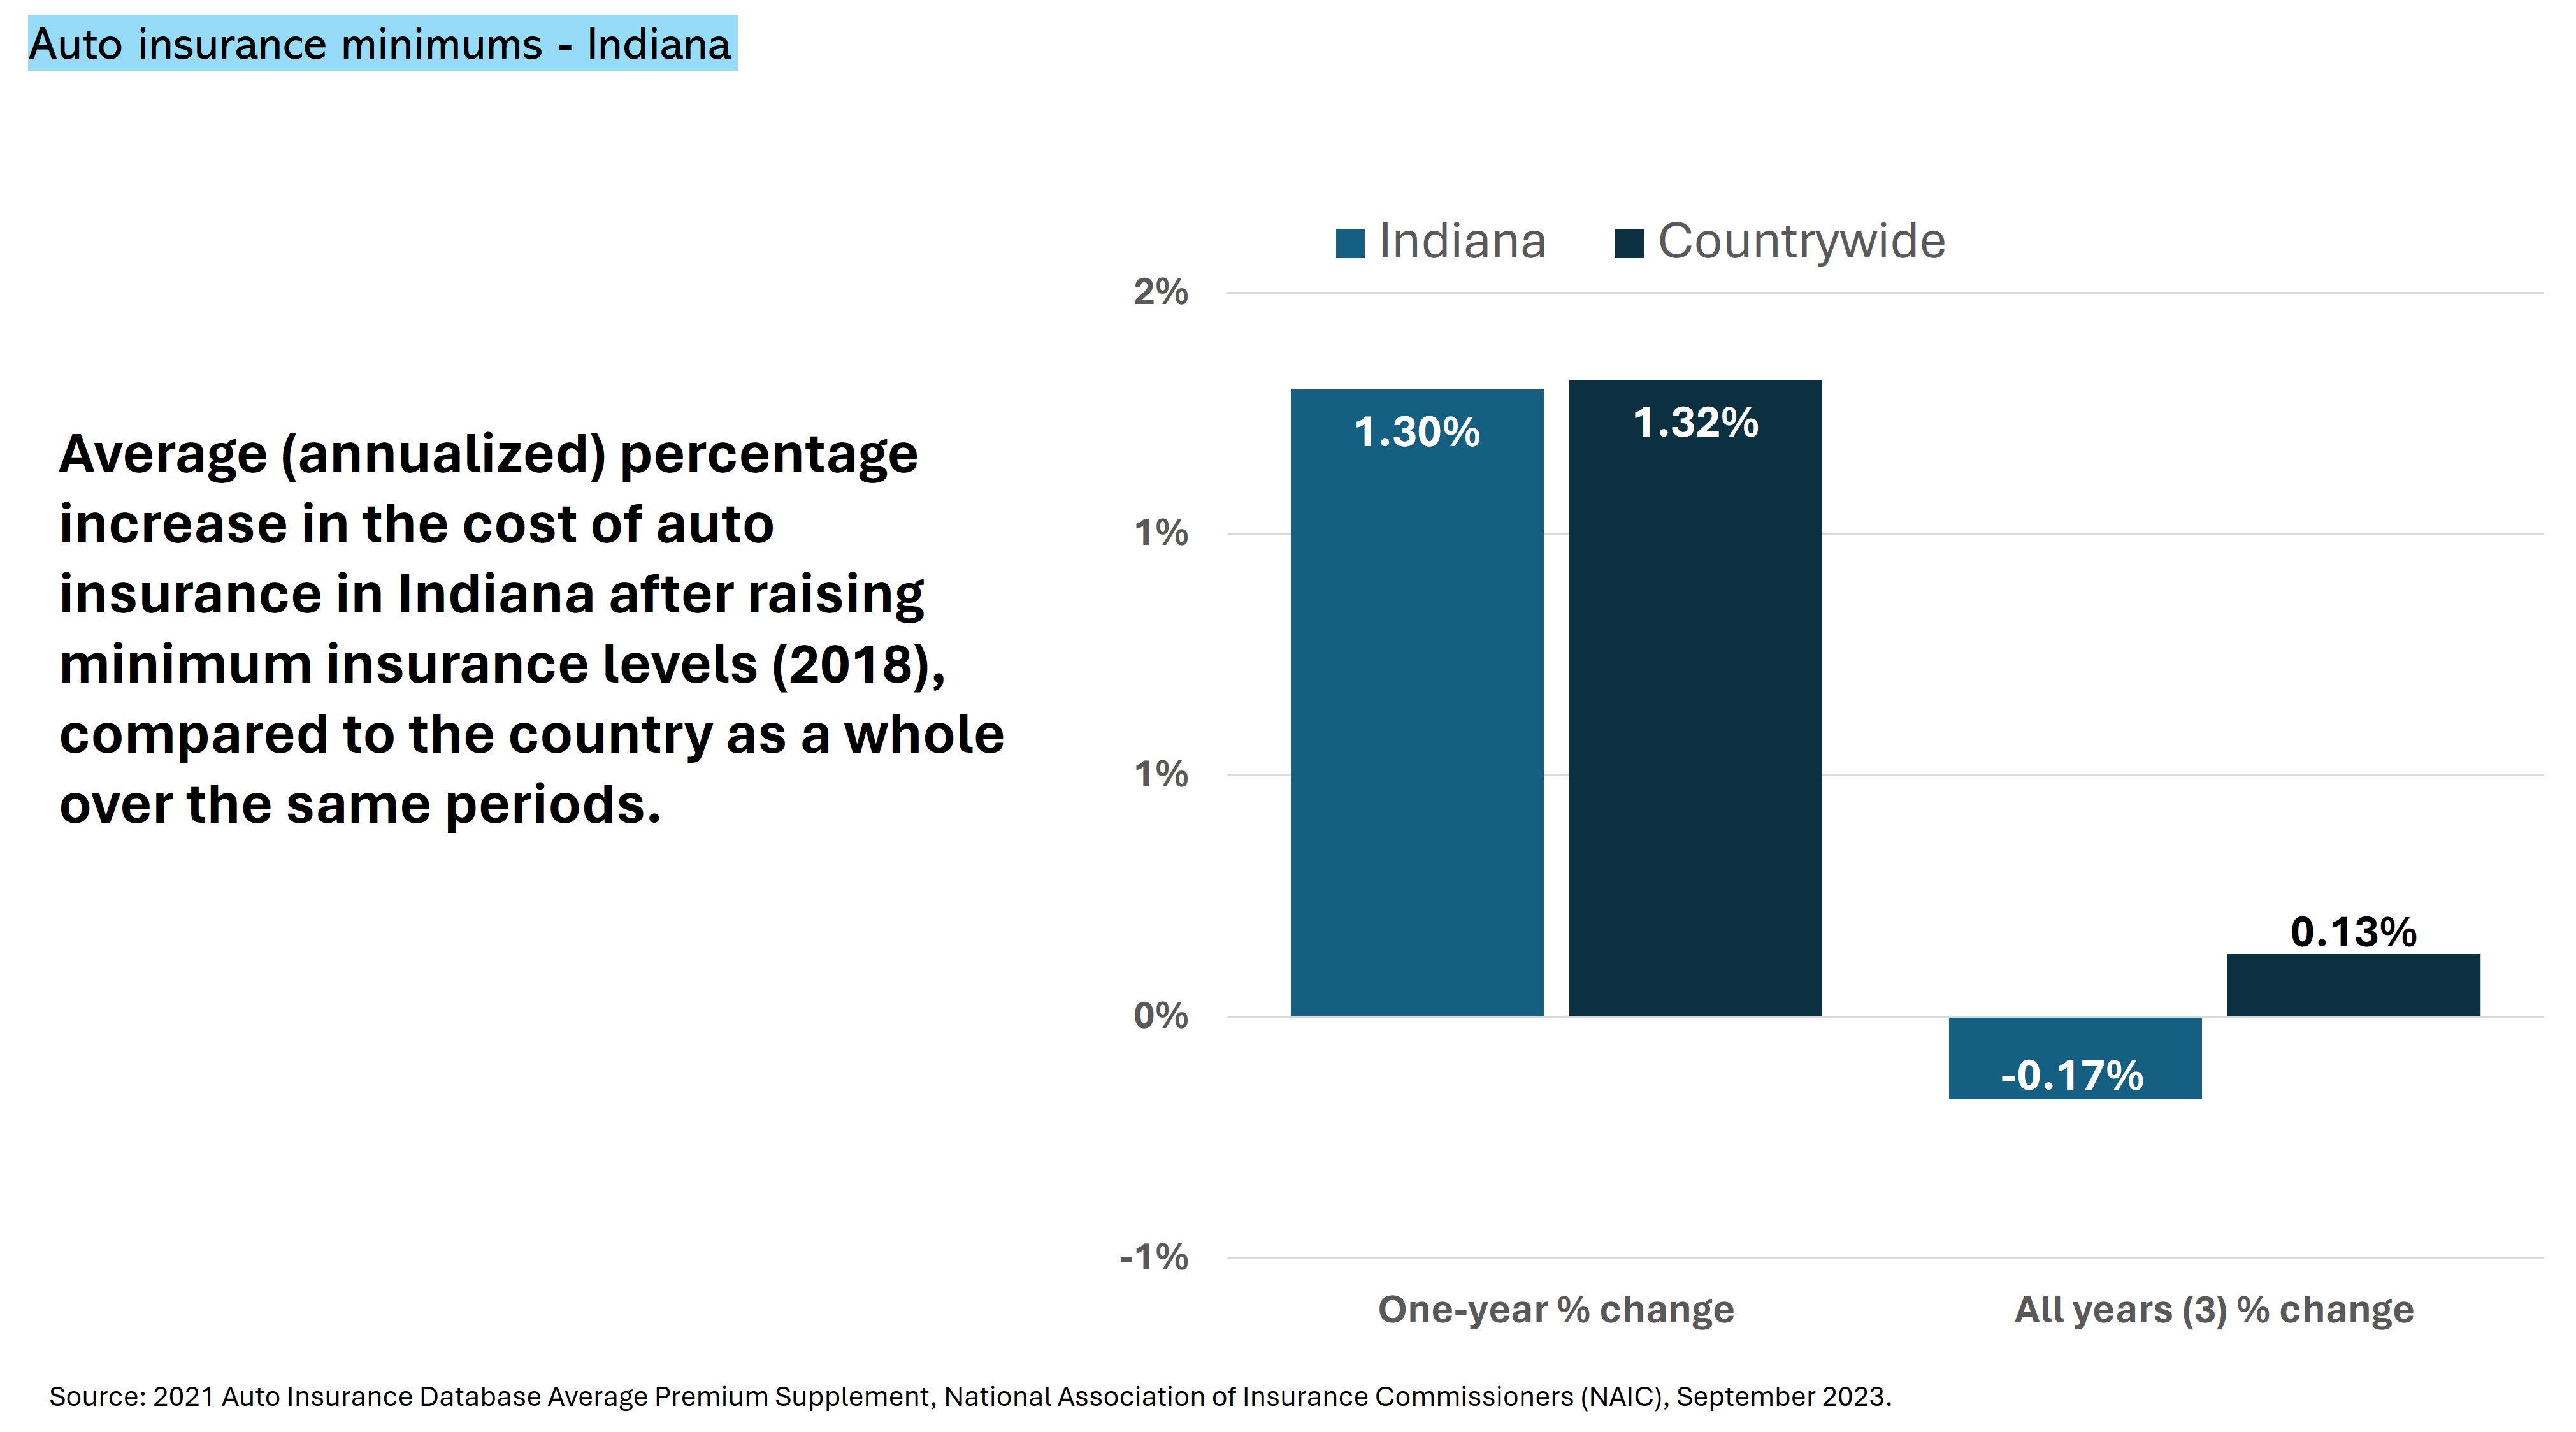
Average (annualized) percentage increase in the cost of auto insurance in states after raising minimum insurance levels, compared to the country as a whole over the same periods.
Alabama
Arizona
Connecticut
Delaware
Illinois
Indiana
Louisiana
Maryland
Michigan
Nevada
Ohio
South Carolina
Texas
Utah
States that have Raised Minimum Insurance Levels (2007-2021)
Annual Economic Cost Due to Motor Vehicle Crashes by State7

Download the Report [PDF]
1. The Economic and Societal Impact of Motor Vehicle Crashes, 2019 (Revised), National Highway Traffic Safety Administration (NHTSA), February 2023, https://crashstats.nhtsa.dot.gov/Api/Public/ViewPublication/813403.
2. Prices Rising 5c on Some Chocolate Bars, The New York Times, October 28, 1976, https://www.nytimes.com/1976/10/28/archives/prices-rising-5c-on-some-chocolate-bars-prices-increasing-on.html; Average Price of a New Car, Transportation Energy Data Book, Oak Ridge National Laboratory, https://tedb.ornl.gov/; New Single-Family Home Prices: 1964-Present, U.S. Department of Housing and Urban Development, https://www.huduser.gov/periodicals/ushmc/winter2001/histdat08.htm.
3. See Methodology for details on NAIC data used.
4. Raising Compulsory Automobile Insurance Minimum Amounts: A Case Study from the United States, Insurance Review, 2019, https://papers.ssrn.com/sol3/papers.cfm?abstract_id=3558165.
5. Raising Compulsory Automobile Insurance Minimum Amounts: A Case Study from the United States, Insurance Review, 2019, https://papers.ssrn.com/sol3/papers.cfm?abstract_id=3558165.
6. Factors Associated with Differences in the Incidence of Uninsured Motorists, Milliman, March 11, 2019.
7. Fatality Facts 2021, Insurance Institute for Highway Safety and the Highway Loss Data Institute (IIHS HLDI, May 2023, https://www.iihs.org/topics/fatality-statistics/detail/state-by-state; The Economic and Societal Impact of Motor Vehicle Crashes, 2019 (Revised), National Highway Traffic Safety Administration (NHTSA), February 2023, https://crashstats.nhtsa.dot.gov/Api/Public/ViewPublication/813403.
About the American Association for Justice® (AAJ)®
The American Association for Justice—formerly the Association of Trial Lawyers of America (ATLA)®—works to preserve the constitutional right to trial by jury and to make sure people have a fair chance to receive justice through the legal system when they are injured by the negligence or misconduct of others—even when it means taking on the most powerful corporations.
Copyright © 2024 American Association for Justice®. Reproduction of any kind is prohibited. For more information, please contact AAJ Research at research@justice.org